Remove Analytics Remove Business Analytics Remove Interactive Remove Visualization
article thumbnail

Creating Interactive and Animated Charts with ipyvizzu

Analytics Vidhya

Introduction Data visualization (DV) plays a crucial role in analyzing and interpreting data. With the growing importance of data science and machine learning, data analysis holds a special place in […] The post Creating Interactive and Animated Charts with ipyvizzu appeared first on Analytics Vidhya.

article thumbnail

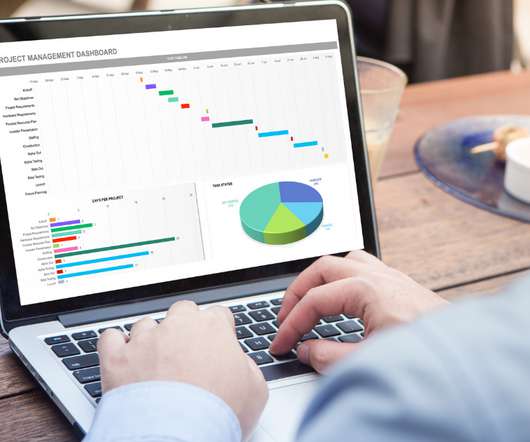
How to Create Stunning and Interactive Dashboards in Excel?

Analytics Vidhya

The post How to Create Stunning and Interactive Dashboards in Excel? appeared first on Analytics Vidhya. In recent times, I have switched to learning Excel as it was a prerequisite in every company I had to apply to. I […].

Insiders

Sign Up for our Newsletter

This site is protected by reCAPTCHA and the Google Privacy Policy and Terms of Service apply.

article thumbnail

Accessible Business Analytics Set to Be a Boon for Small Businesses

Smart Data Collective

It’s hard to overestimate the value that data insights have come to represent to today’s businesses. Investments in analytics tech have risen commensurately, with some 73 percent of respondents telling IDC that they expect to spend more on data-focused software than any other category in 2023. Consolidating Information.

article thumbnail

Getting Started with Data Analysis using Power BI

Analytics Vidhya

Microsoft‘s business analytics product, Power BI, delivers interactive data visualization BI capabilities that allow users to see and share data and insights throughout their organisation. Power BI provides insight data by using data interactively and exploring it by visualizations. […].

article thumbnail

Visualize Amazon DynamoDB insights in Amazon QuickSight using the Amazon Athena DynamoDB connector and AWS Glue

AWS Big Data

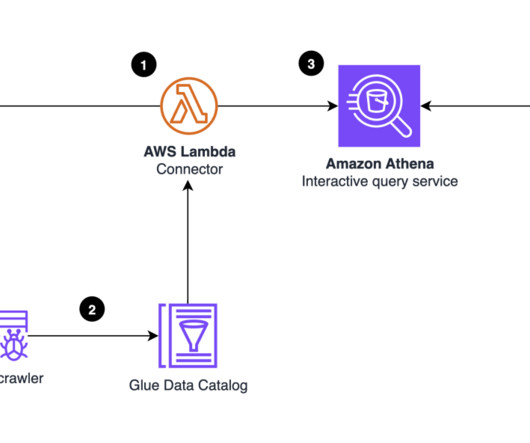
Athena is a serverless, interactive service that allows you to query data from a variety of sources in heterogeneous formats, with no provisioning effort. Finally, to visualize BI insights, you can use Amazon QuickSight , a cloud-powered business analytics service. Choose Create data source.

article thumbnail

The Power Of Real Time Analytics & Business Intelligence Explained

datapine

As such, we have to find approaches to data analytics and business intelligence. Not to forget, to squeeze the most value from your business’s most valuable data across touchpoints, it’s important to analyze it as it unfolds. Download our executive, pocket-sized guide to real time BI and analytics!

article thumbnail

Business Intelligence and Analytics: Definitive Guide

FineReport

As companies striving to embrace digital transformation and become data-driven, business intelligence and analytics skills and experience are essential to building a data-savvy team. However, if someone puts you on the spot, can you clearly tell the difference between business intelligence and analytics? Definition.