article thumbnail

6 Case Studies on The Benefits of Business Intelligence And Analytics

datapine

Using business intelligence and analytics effectively is the crucial difference between companies that succeed and companies that fail in the modern environment. Experience the power of Business Intelligence with our 14-days free trial! Why Is Business Intelligence So Important? The power of knowledge.

article thumbnail

5 Ways to Use Digital Signage for Data-Centric B2B Companies

Smart Data Collective

However, data analytics technology can be just as useful with regards to creating a successful B2B business. Business-to-business companies need to understand their customers and market to them just as effectively. One of the benefits of data analytics in B2B marketing is with using digital signage.

B2B 113
Insiders

Sign Up for our Newsletter

This site is protected by reCAPTCHA and the Google Privacy Policy and Terms of Service apply.

article thumbnail

28 Sales Reports Examples You Can Use For Daily, Weekly or Monthly Reports

datapine

Visualize and communicate your findings : the most important part, once you have analyzed and dug out insights from your data, is to convey this information to your audience. Using a professional business intelligence dashboard that works with real-time data will always let you up to date when sharing your insights.

Sales 264
article thumbnail

WEBCAST: Analytics Through the Lens of Conversational AI

bridgei2i

Business Intelligence (BI) has always been a valuable aid for decision making. Essentially, data can converse with a busy executive on the go. The internet and the advent of cloud technologies have made possible easy-to-use interfaces, in the form of various visualizations and dashboards, and enabled on-demand analytics.

article thumbnail

KPI Management And Best Practices: How To Find The Perfect KPI Solutions?

datapine

Catchy headlines, backlinks to relevant influencer content, the seamless placement of a numbered or bulleted and visuals are some of the key drivers of successful digital content. Offer online data visualization tools that are clear, concise, and tell a story.

KPI 221
article thumbnail

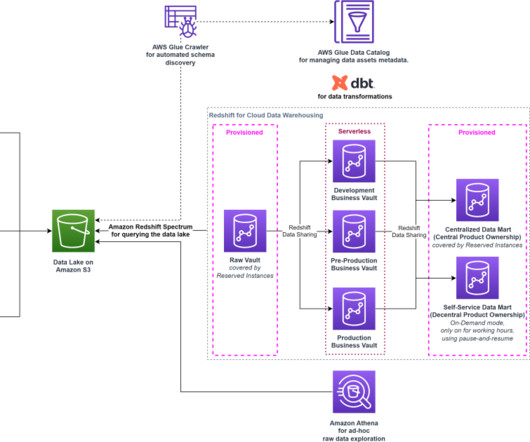
Reference guide to analyze transactional data in near-real time on AWS

AWS Big Data

Data analysis and visualization After the data pipeline is set up, the last piece is data analysis with Amazon QuickSight to visualize the changes in consumer behavior. In a single data dashboard, QuickSight can include AWS data, third-party data, big data, spreadsheet data, SaaS data, B2B data, and more.

article thumbnail

Top 10 IT & Technology Buzzwords You Won’t Be Able To Avoid In 2020

datapine

Exciting and futuristic, the concept of computer vision is based on computing devices or programs gaining the ability to extract detailed information from visual images. Visual analytics: Around three million images are uploaded to social media every single day. Artificial Intelligence (AI). Blockchain.