Remove Book Remove Business Analytics Remove Dashboards Remove Marketing
article thumbnail

Accessible Business Analytics Set to Be a Boon for Small Businesses

Smart Data Collective

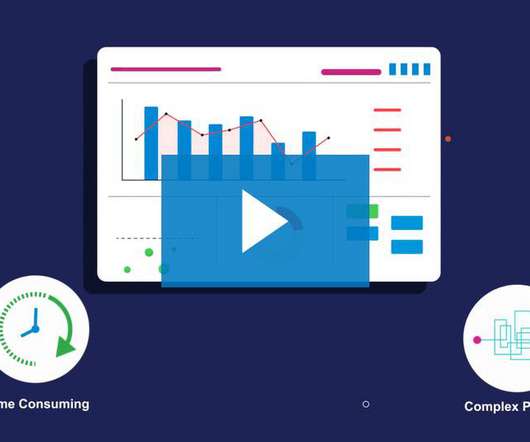
Modern business intelligence platforms can integrate with hundreds of data sources like marketing communication tools, ecommerce platforms and payment providers to create this holistic picture. Businesses that use cross-functional management suites can also explore their built-in analytics tools.

article thumbnail

Master Data Visualization Techniques: A Comprehensive Guide

FineReport

Applications in Various Fields In Business , data visualization is used for sales analysis , market forecasting, and performance KPI tracking. For instance, in financial analysis, line plots are utilized to track stock prices over specific periods, enabling analysts to identify market trends efficiently.

Insiders

Sign Up for our Newsletter

This site is protected by reCAPTCHA and the Google Privacy Policy and Terms of Service apply.

Trending Sources

article thumbnail

How Macmillan Publishers authored success using IBM Cognos Analytics

IBM Big Data Hub

If you’re a reader, chances are good you’ve read a book from Macmillan. For more than 10 years, the publisher has used IBM Cognos Analytics to wrangle its internal and external operational reporting needs. This data is leveraged by departments throughout the organization and is essential to their business operations.

article thumbnail

Unlock The Power of Your Data With These 19 Big Data & Data Analytics Books

datapine

With that in mind, we have prepared a list of the top 19 definitive data analytics and big data books, along with magazines and authentic readers’ reviews upvoted by the Goodreads community. Essential Big Data And Data Analytics Insights. Discover The Best Data Analytics And Big Data Books Of All Time.

Big Data 263
article thumbnail

KPI Management And Best Practices: How To Find The Perfect KPI Solutions?

datapine

To answer this most critical of questions, here’s a little help from a renowned author and industry expert: Bernard Marr is the author of several books, including Key Performance Indicators for Dummies and Key Performance Indicators: The 75+ Measures Every Manager Needs to Know. Provide a methodical approach to KPI dashboards and reports.

KPI 221
article thumbnail

Fact-based Decision-making

Peter James Thomas

There is also (as referenced by Neil in his comments above) the delayed booking of transactions in order to – with the nicest possible description – smooth revenues. This is why performance management is a very complex discipline, not just the implementation of dashboard or scorecard technology. One of my Top Ten films. [6].

Metrics 49
article thumbnail

How to Take Your Data Visualization Skills to the Next Level

Depict Data Studio

advanced techniques like applying data visualization principles to reports, slideshows, infographics, and dashboards. I checked out books from the library. You’ll think about which format–a report, dashboard, infographic, one-pager, etc.–is practical software how-tos? I took seminars. Analyze Your Audience.