Remove Book Remove Business Analytics Remove Forecasting Remove Marketing
article thumbnail

Master Data Visualization Techniques: A Comprehensive Guide

FineReport

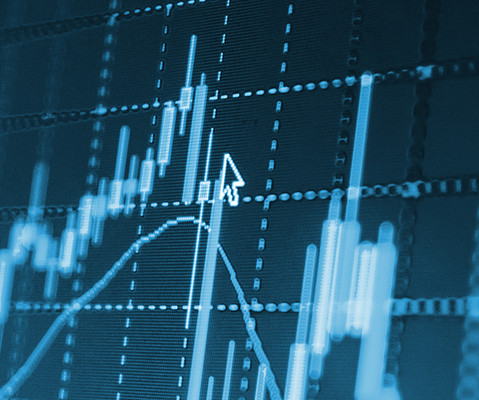
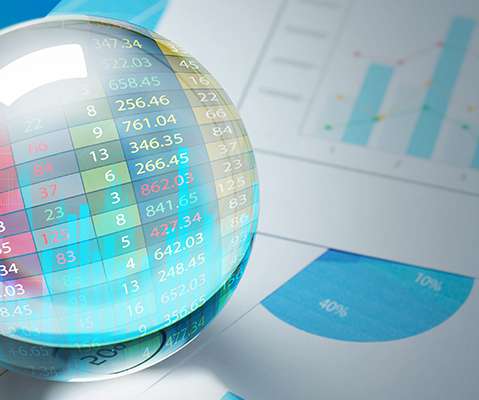
Applications in Various Fields In Business , data visualization is used for sales analysis , market forecasting, and performance KPI tracking. For instance, in financial analysis, line plots are utilized to track stock prices over specific periods, enabling analysts to identify market trends efficiently.

article thumbnail

Unlock The Power of Your Data With These 19 Big Data & Data Analytics Books

datapine

With that in mind, we have prepared a list of the top 19 definitive data analytics and big data books, along with magazines and authentic readers’ reviews upvoted by the Goodreads community. Essential Big Data And Data Analytics Insights. Discover The Best Data Analytics And Big Data Books Of All Time.

Big Data 263
Insiders

Sign Up for our Newsletter

This site is protected by reCAPTCHA and the Google Privacy Policy and Terms of Service apply.

Trending Sources

article thumbnail

KPI Management And Best Practices: How To Find The Perfect KPI Solutions?

datapine

To answer this most critical of questions, here’s a little help from a renowned author and industry expert: Bernard Marr is the author of several books, including Key Performance Indicators for Dummies and Key Performance Indicators: The 75+ Measures Every Manager Needs to Know. Marketing: How well are we hitting our business objectives?

KPI 221
article thumbnail

Augmented Analytics Algorithms and Techniques: Learning for Citizen Data Scientists

Smarten

Use Case(s): Weather Forecasting, Fraud Analysis and more. Frequent Pattern Mining (Association): What is Frequent Pattern Mining (Association) and How Does it Support Business Analysis? Use Case(s): Market Basket Analysis, Frequently Bundled Products and more.

article thumbnail

What is The Difference Between BI and Analytics?

Jet Global

BI and analytics are both umbrella terms referring to a type of data insight software. Many providers use them interchangeably, but some use them in conjunction, claiming to offer both business intelligence and business analytics. One school of thought distinguishes BI and business analytics along these past/future lines.

article thumbnail

insightsoftware Ranks in the Gartner Magic Quadrant for Financial Close and Consolidation Solutions

Jet Global

Understanding the Magic Quadrant The Magic Quadrant graphic is a disarmingly simple representation of the state of a market. It provides a graphical comparative positioning of technology and service providers with high market growth and product differentiation. Market Responsiveness.

article thumbnail

Why Construction Businesses Should Track KPIs to Conquer Economic Uncertainty

Jet Global

How deeply will projects be impacted by market instability, skills shortages, and supply chain delays? According to Oxford Economics’ Future of Construction Report , the construction market is expected to grow by $4.5 As a result, measuring success by financials alone isn’t enough for construction and engineering professionals.