Remove Book Remove Dashboards Remove Data Integration Remove Visualization
article thumbnail

What is IoT Dashboard?

FineReport

Among the tools that have emerged from this digital transformation, IoT dashboards stand out as invaluable assets. In this article, we will explore the concept of IoT dashboards, delve into their benefits, examine real-life examples, and highlight the essential features that make them indispensable in the IoT landscape.

IoT 52
article thumbnail

Mastering Data Visualization Jobs: Your Step-by-Step Career Guide

FineReport

Discovering the World of Data Visualization Jobs In today’s data-driven world, data visualization jobs play a crucial role in transforming complex information into visually appealing and easy-to-understand graphics. But what exactly are data visualization jobs, and why are they important?

Insiders

Sign Up for our Newsletter

This site is protected by reCAPTCHA and the Google Privacy Policy and Terms of Service apply.

article thumbnail

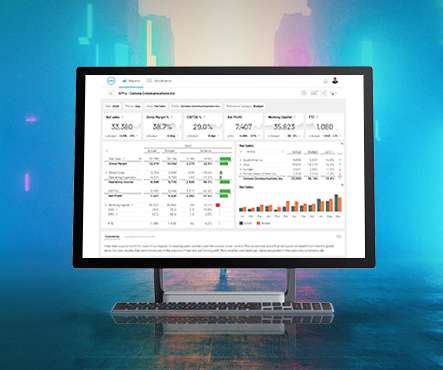
Financial Dashboard: Definition, Examples, and How-tos

FineReport

In today’s dynamic business environment, gaining comprehensive visibility into financial data is crucial for making informed decisions. This is where the significance of a financial dashboard shines through. What is A Financial Dashboard? You can download FineReport for free and have a try! Free Download of FineReport 1.

article thumbnail

What is a KPI Report? Definition, Examples, and How-tos

FineReport

Typically displayed as an interactive dashboard, this type of report visually presents information related to a predetermined set of key performance indicators. An effectively crafted KPI report, featuring a well-structured dashboard, offers invaluable insights presented in a user-friendly manner, ensuring comprehensibility for all.

KPI 52
article thumbnail

10 Best Big Data Analytics Tools You Need To Know in 2023

FineReport

” This type of Analytics includes traditional query and reporting settings with scorecards and dashboards. Having visually appealing graphics can also increase user adoption. The tool is designed to be intuitive, so even users with limited technical expertise can create reports and dashboards quickly and easily.

article thumbnail

Five benefits of a data catalog

IBM Big Data Hub

You have a specific book in mind, but you have no idea where to find it. You enter the title of the book into the computer and the library’s digital inventory system tells you the exact section and aisle where the book is located.

article thumbnail

Daily Sales Report: Definition, Samples, Key Elements, and How-tos

FineReport

In order to meet the requirements on the style and design of reports in different scenarios, FineReport supports three different types of reports: Normal Report, Dashboard and Aggregation Report, which can generally cover different needs from different working scenarios. These reports are all produced by FineReport.

Sales 52