Remove Book Remove Data Warehouse Remove Key Performance Indicator Remove Strategy
article thumbnail

Combine transactional, streaming, and third-party data on Amazon Redshift for financial services

AWS Big Data

This stack creates the following resources and necessary permissions to integrate the services: Data stream – With Amazon Kinesis Data Streams , you can send data from your streaming source to a data stream to ingest the data into a Redshift data warehouse. version cluster. version cluster.

article thumbnail

Introduction To The Basic Business Intelligence Concepts

datapine

According to Better Buys, 85% of business leaders feel that using big data to their advantage will significantly improve the way they run their companies – and they’re not wrong. When approached correctly, pattern recognition is one of the key hallmarks that distinguishes BI experts from BI amateurs. The data warehouse.

Insiders

Sign Up for our Newsletter

This site is protected by reCAPTCHA and the Google Privacy Policy and Terms of Service apply.

Trending Sources

article thumbnail

20 Best Logistics KPIs and Metric Examples for 2022 Reporting

Jet Global

A logistics key performance indicator (KPI) is a quantitative tool used by businesses to measure performance within their logistics department. A logistics key performance indicator (KPI) is a quantitative tool used by businesses to measure performance within their logistics department.

Metrics 84
article thumbnail

30 Best Accounting KPIs and Metric Examples for 2021 Reporting

Jet Global

An accounting Key Performance Indicator (KPI) or metric is an explicitly defined and quantifiable measure that the accounting industry uses to gauge its overall long-term performance. KPIs for accounting departments differ based on the type of accounting function they perform. What is an Accounting KPI?

Metrics 110
article thumbnail

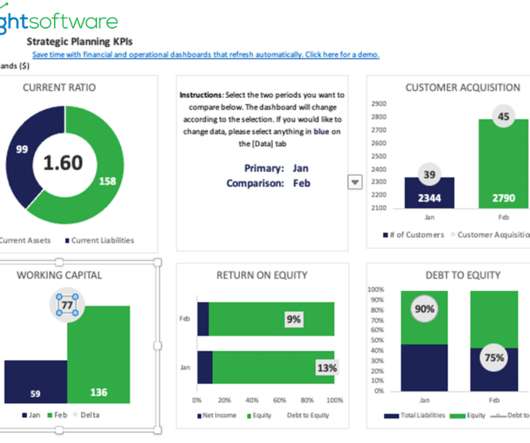
Financial Dashboard: Definition, Examples, and How-tos

FineReport

A financial dashboard, one of the most important types of data dashboards , functions as a business intelligence tool that enables finance and accounting teams to visually represent, monitor, and present financial key performance indicators (KPIs).

article thumbnail

Mastering BI Dashboard Tools: Your Essential Guide

FineReport

Key components of well-designed dashboards include: Data Source Connections: BI dashboards connect to diverse data sources, including data warehouses, data marts, operational systems, and external feeds, ensuring comprehensive analytics insights.

article thumbnail

A Guide To Starting A Career In Business Intelligence & The BI Skills You Need

datapine

This all-encompassing branch of online data analysis is a particularly interesting field because its roots are firmly planted in two separate areas: business strategy and computer science. To help you with your studies, you can start here with a list of the best SQL books that will help you take your skills to the next level.