Remove Business Intelligence Remove Dashboards Remove Data-driven Remove ROI
article thumbnail

Common Business Intelligence Challenges Facing Entrepreneurs

datapine

“BI is about providing the right data at the right time to the right people so that they can take the right decisions” – Nic Smith. Data analytics isn’t just for the Big Guys anymore; it’s accessible to ventures, organizations, and businesses of all shapes, sizes, and sectors. Let’s get started!

article thumbnail

The Ultimate Guide to Modern Data Quality Management (DQM) For An Effective Data Quality Control Driven by The Right Metrics

datapine

1) What Is Data Quality Management? 4) Data Quality Best Practices. 5) How Do You Measure Data Quality? 6) Data Quality Metrics Examples. 7) Data Quality Control: Use Case. 8) The Consequences Of Bad Data Quality. 9) 3 Sources Of Low-Quality Data. 10) Data Quality Solutions: Key Attributes.

Insiders

Sign Up for our Newsletter

This site is protected by reCAPTCHA and the Google Privacy Policy and Terms of Service apply.

article thumbnail

Huge Benefits of Business Intelligence for Your Company

Smart Data Collective

Introduction: What is Business Intelligence? Business Intelligence is the collection, storage, analysis, and reporting of data to make better business decisions. It can refer to predictive analytics or even “big data.” How Do I Digitize My Data to Get the Most Out of My BI Strategy?

article thumbnail

Your Guide To Modern Agency Analytics, Dashboards & Reporting Techniques

datapine

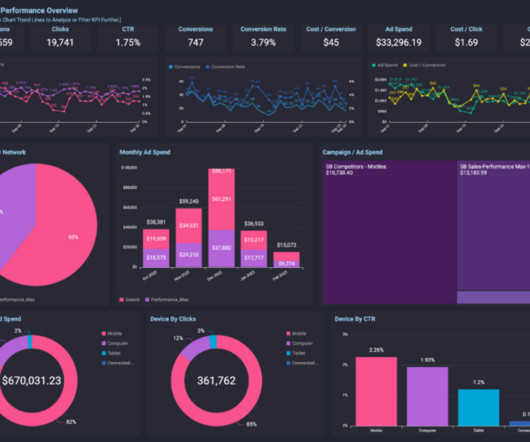
The answer is modern agency analytics reports and interactive dashboards. Starting with its definition, following with the benefits of agency reports, a list of tools, and a set of agency dashboard examples. Agencies benefit from interactive dashboard tools to prove the success of their strategies and campaigns to clients.

article thumbnail

Monetizing Analytics Features: Why Data Visualizations Will Never Be Enough

Think your customers will pay more for data visualizations in your application? But today, dashboards and visualizations have become table stakes. Discover which features will differentiate your application and maximize the ROI of your embedded analytics. Five years ago they may have. Brought to you by Logi Analytics.

article thumbnail

How Novanta’s CIO mobilized its data-driven transformation

CIO Business Intelligence

When I joined, there was a lot of silo data everywhere throughout the organization, and everyone was doing their own reporting. It was also a lot of churning for the different groups to come up with those data on the weekly, monthly and quarterly basis.” But where to begin? “We That’s the first level of a cultural shift.

article thumbnail

Get Started With Business Performance Dashboards – Examples & Templates

datapine

If you don’t have the vision or don’t know what to do with it, you’ll find yourself shooting in the dark – and that is detrimental to the growth and evolution of any business, regardless of size or sector. Exclusive Bonus Content: Stay on top of your business performance! The Link Between Data And Business Performance.