Remove Business Intelligence Remove Data Warehouse Remove Publishing Remove Visualization
article thumbnail

Visualize Your Data With Google Looker Studio

Analytics Vidhya

This article was published as a part of the Data Science Blogathon. Source: [link] Introduction In today’s digital world, data is generated at a swift pace. Data in itself is not useful unless we present it in a meaningful way and derive insights that help in making key business decisions.

article thumbnail

Understanding Social And Collaborative Business Intelligence

datapine

Almost all the major software companies are continuously making use of the leading Business Intelligence (BI) and Data discovery tools available in the market to take their brand forward. Let us take a look into the individual concepts of social and collaborative business intelligence to learn more about how they help companies.

Insiders

Sign Up for our Newsletter

This site is protected by reCAPTCHA and the Google Privacy Policy and Terms of Service apply.

Trending Sources

article thumbnail

Business Intelligence vs Data Science vs Data Analytics

FineReport

Good data can give you keen insights, convincing evidence to make informed decisions. By observing and analyzing data, we can develop more accurate theories and formulate more effective solutions. For this reason, data science and/vs. Definition: BI vs Data Science vs Data Analytics. What is Business Intelligence?

article thumbnail

Enhance monitoring and debugging for AWS Glue jobs using new job observability metrics, Part 3: Visualization and trend analysis using Amazon QuickSight

AWS Big Data

However, to analyze trends over time, aggregate from different dimensions, and share insights across the organization, a purpose-built business intelligence (BI) tool like Amazon QuickSight may be more effective for your business. Select Publish new dashboard as , and enter GlueObservabilityDashboard.

Metrics 110
article thumbnail

Power analytics as a service capabilities using Amazon Redshift

AWS Big Data

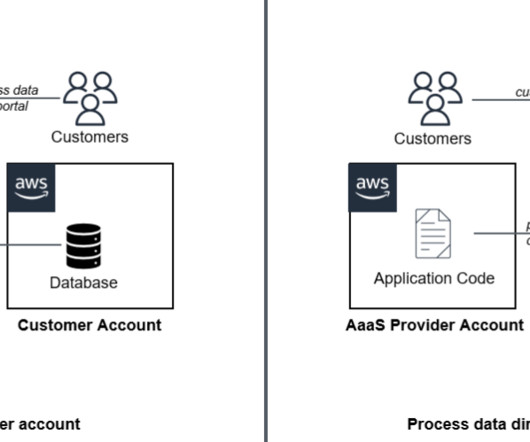
The AaaS model accelerates data-driven decision-making through advanced analytics, enabling organizations to swiftly adapt to changing market trends and make informed strategic choices. times better price-performance than other cloud data warehouses. Data processing jobs enrich the data in Amazon Redshift.

article thumbnail

Take Your SQL Skills To The Next Level With These Popular SQL Books

datapine

Business leaders, developers, data heads, and tech enthusiasts – it’s time to make some room on your business intelligence bookshelf because once again, datapine has new books for you to add. We have already given you our top data visualization books , top business intelligence books , and best data analytics books.

article thumbnail

Extend Power BI with Custom Visuals

Jet Global

Microsoft has invested heavily in its business intelligence (BI) and analytics platforms for over 12 years. As one of the most widely used data visualization tools in the world, Power BI has made some huge improvements to creating custom visualizations that we want to share with you. Custom Visuals for Power BI.