article thumbnail

What is Data Visualization: Complete Guide 2024

FineReport

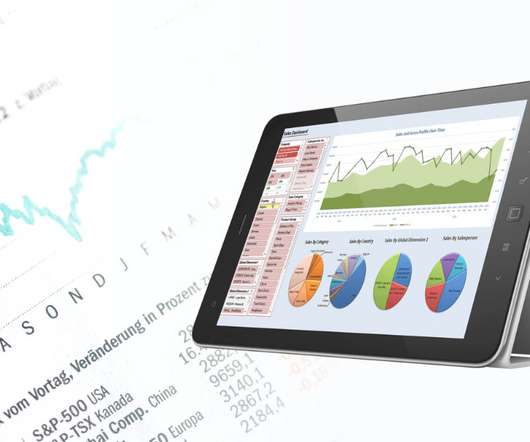
What is Data Visualization Understanding the Concept Data visualization, in simple terms, refers to the presentation of data in a visual format. By utilizing visual elements, data visualization allows individuals to grasp difficult concepts or identify new patterns within the data.

article thumbnail

KPI Management And Best Practices: How To Find The Perfect KPI Solutions?

datapine

Catchy headlines, backlinks to relevant influencer content, the seamless placement of a numbered or bulleted and visuals are some of the key drivers of successful digital content. When selecting KPIs to measure success, align them closely with your overarching business objectives.

KPI 221
Insiders

Sign Up for our Newsletter

This site is protected by reCAPTCHA and the Google Privacy Policy and Terms of Service apply.

Trending Sources

article thumbnail

A Guide To The Top 14 Types Of Reports With Examples Of When To Use Them

datapine

Businesses often use them to track which of their products or subscriptions are selling the most within a given time period, calculate inventories, or see what kind of product the client values the most. Let’s see it more in detail with a visual example. This reporting type refers to the direction in which a report travels.

Reporting 201
article thumbnail

A Guide To Starting A Career In Business Intelligence & The BI Skills You Need

datapine

The specific skills needed for business intelligence will vary according to whether you want to be more of a back-end or a front-end BI professional. To simplify things, you can think of back-end BI skills as more technical in nature and related to building BI platforms, like online data visualization tools. BI developer.

article thumbnail

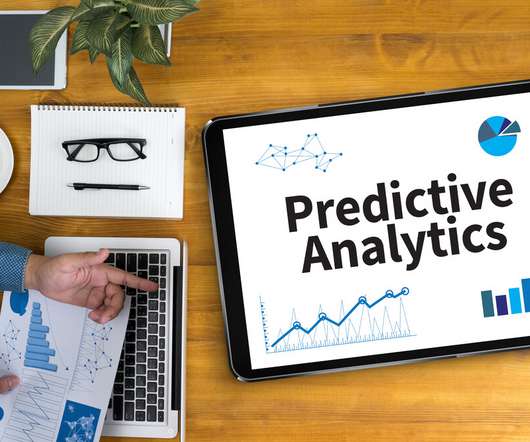
Predictive Analytics: 4 Primary Aspects of Predictive Analytics

Smart Data Collective

Predictive analytics, sometimes referred to as big data analytics, relies on aspects of data mining as well as algorithms to develop predictive models. Early adopters and practitioners that use past data and predictive analytics deployment without meeting key objectives are likely missing out on some of the key components of such a model.

article thumbnail

Create an end-to-end data strategy for Customer 360 on AWS

AWS Big Data

It is prudent to consolidate this data into a single customer view, serving as a primary reference for downstream applications, ranging from ecommerce platforms to CRM systems. Strategize based on how your teams explore data, run analyses, wrangle data for downstream requirements, and visualize data at different levels.

article thumbnail

Cloud Analytics Powered by FinOps

Cloudera

Agility, innovation, and time-to-value are the key differentiators cloud service providers (CSP) claim to help organizations speed up digital transformation projects and business objectives. Technology, finance, and operations collaborate to bring financial accountability to cloud spend.