Remove Consulting Remove Dashboards Remove Key Performance Indicator Remove Measurement
article thumbnail

Management Dashboard: New Assistant of Modern Management

FineReport

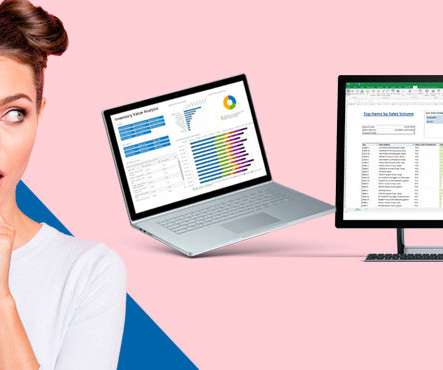
What is management dashboard? Management dashboard is suitable for different business fields and various departments of enterprises. In the form of easy-to-read charts and numbers, management dashboard displays all important business key performance indicators (KPIs) on the corresponding dashboards.

article thumbnail

How To Improve Your Facility Management With Healthcare Reports

datapine

Like many of today’s most important industries, digital data, metrics and KPIs (key performance indicators) are a part of a bright and prosperous future – and a comprehensive healthcare report has the power to deliver in each of these critical areas. The Benefits Of A Healthcare Report. Preventative management.

Reporting 198
Insiders

Sign Up for our Newsletter

This site is protected by reCAPTCHA and the Google Privacy Policy and Terms of Service apply.

article thumbnail

What Is An Operational Report? A Complete Guide

FineReport

Identifying areas for enhancement : By utilizing operational reports to track key performance indicators (KPIs), businesses can pinpoint areas that are underperforming and take necessary measures to improve them. Operational reports incorporate tools such as dashboards, metrics, and Key Performance Indicators (KPIs).

article thumbnail

30 Best Manufacturing KPIs and Metric Examples for 2021 Reporting

Jet Global

An Operations Key Performance Indicator (KPI) or metric is a discrete measurement that a company uses to monitor and evaluate the efficiency of its day-to-day operations. Leading companies make use of KPIs and KPI dashboards to measure their efficiency in real time. What is an Operations KPI?

Metrics 131
article thumbnail

What is Integrated Business Planning (IBP)?

IBM Big Data Hub

The term ‘IBP’ was introduced by the management consulting firm Oliver Wight to describe an evolved version of the sales and operations planning (S&OP process) they originally developed in the early 1980s. Making up the IBP framework are six key pillars: 1.

article thumbnail

Combine transactional, streaming, and third-party data on Amazon Redshift for financial services

AWS Big Data

You can run a direct query from QuickSight for BI reporting and dashboards. You can use Amazon Managed Grafana for near-real-time trade dashboards that are refreshed every few seconds. Historical quotes analysis In this section, we explore some examples of historical quotes analysis from the Amazon QuickSight dashboard.

article thumbnail

Common Business Intelligence Challenges Facing Entrepreneurs

datapine

Also, limited resources make looking for qualified professionals such as data science experts, IT infrastructure professionals and consulting analysts impractical and worrisome. Check out this investor relations dashboard example below, part of our management dashboard series: **click to enlarge**.