Remove Dashboards Remove Data Analytics Remove Forecasting Remove Reporting
article thumbnail

Utilizing Data Analytics To Create Seamless Web Dashboards

Smart Data Collective

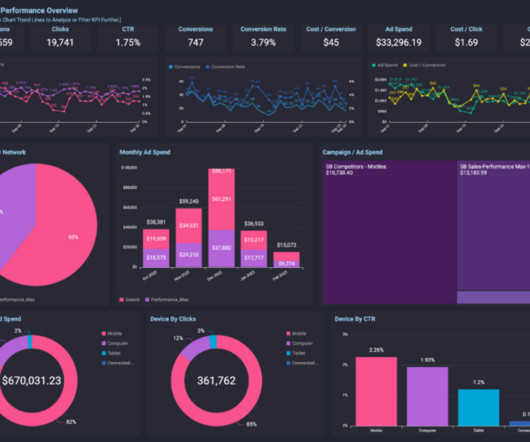
They also use trend forecasting and customer behavioral analysis to adapt their business models to boost business. However, none of these features would be viable without web dashboards. We talked about the benefits of business dashboards before , but web dashboards have their own benefits. What is a web dashboard?

article thumbnail

An Introduction To Data Dashboards: Meaning, Definition & Industry Examples

datapine

Enter data dashboards – one of history’s best innovations in business intelligence. To help you understand this notion in full, we’re going to explore a data dashboard definition, explain the power of dashboard data, and explore a selection of data dashboard examples. What Is A Data Dashboard?

Insiders

Sign Up for our Newsletter

This site is protected by reCAPTCHA and the Google Privacy Policy and Terms of Service apply.

Trending Sources

article thumbnail

Get Started With Business Performance Dashboards – Examples & Templates

datapine

That said, if you’re looking to evolve your empire, increase brand awareness, and boost your bottom line, embracing business performance dashboards and big data should be at the top of your priority list. The Link Between Data And Business Performance. What Is A Performance Dashboard In Business? Still unsure?

article thumbnail

What is data analytics? Analyzing and managing data for decisions

CIO Business Intelligence

What is data analytics? Data analytics is a discipline focused on extracting insights from data. It comprises the processes, tools and techniques of data analysis and management, including the collection, organization, and storage of data. What are the four types of data analytics?

article thumbnail

Using ODBC in Excel to Create Sales Reports After Mining Sales Data

Smart Data Collective

One of the most important is collecting revenue data to draft financial statements, forecast future sales and make decisions to address revenue shortfalls. These factors are why companies will spend over $12 billion on data analytics for marketing solutions by 2027. Report on Sales Forecasts.

Sales 106
article thumbnail

Unveiling the Top 10 Data Visualization Companies of 2024

FineReport

Through different types of graphs and interactive dashboards , business insights are uncovered, enabling organizations to adapt quickly to market changes and seize opportunities. Criteria for Top Data Visualization Companies Innovation and Technology Cutting-edge technology lies at the core of top data visualization companies.

article thumbnail

Management Dashboard: New Assistant of Modern Management

FineReport

What is management dashboard? Management dashboard is suitable for different business fields and various departments of enterprises. In the form of easy-to-read charts and numbers, management dashboard displays all important business key performance indicators (KPIs) on the corresponding dashboards. Request Demo.