Remove Dashboards Remove Data Integration Remove Data Warehouse Remove Data-driven
article thumbnail

Announcing zero-ETL integrations with AWS Databases and Amazon Redshift

AWS Big Data

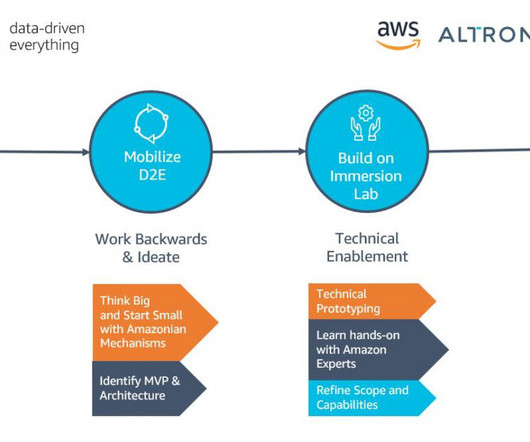
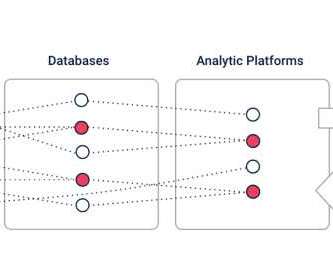
As customers become more data driven and use data as a source of competitive advantage, they want to easily run analytics on their data to better understand their core business drivers to grow sales, reduce costs, and optimize their businesses. ETL is the process data engineers use to combine data from different sources.

article thumbnail

Enhance monitoring and debugging for AWS Glue jobs using new job observability metrics, Part 3: Visualization and trend analysis using Amazon QuickSight

AWS Big Data

Grafana provides powerful customizable dashboards to view pipeline health. QuickSight makes it straightforward for business users to visualize data in interactive dashboards and reports. QuickSight makes it straightforward for business users to visualize data in interactive dashboards and reports.

Metrics 106
Insiders

Sign Up for our Newsletter

This site is protected by reCAPTCHA and the Google Privacy Policy and Terms of Service apply.

Trending Sources

article thumbnail

Enhance monitoring and debugging for AWS Glue jobs using new job observability metrics

AWS Big Data

For any modern data-driven company, having smooth data integration pipelines is crucial. These pipelines pull data from various sources, transform it, and load it into destination systems for analytics and reporting. Undetected errors result in bad data and impact downstream analysis.

Metrics 97
article thumbnail

With a zero-ETL approach, AWS is helping builders realize near-real-time analytics

AWS Big Data

Data is at the center of every application, process, and business decision. When data is used to improve customer experiences and drive innovation, it can lead to business growth. According to Forrester , advanced insights-driven businesses are 8.5 Firstly, it invariably requires data engineers to create custom code.

article thumbnail

The 6-Step Guide to Integrating Business Intelligence and Analytics

Smart Data Collective

Business Intelligence is the practice of collecting and analyzing data and transforming it into useful, actionable information. Business Intelligence uses methods and tools like machine learning to take massive, unstructured swaths of data and turn them into easy-to-use reports. Set Up Data Integration.

article thumbnail

Five benefits of a data catalog

IBM Big Data Hub

An enterprise data catalog does all that a library inventory system does – namely streamlining data discovery and access across data sources – and a lot more. For example, data catalogs have evolved to deliver governance capabilities like managing data quality and data privacy and compliance.

article thumbnail

Enterprise Reporting: The 2020’s Comprehensive Guide

FineReport

Enterprise reporting is a process of extracting, processing, organizing, analyzing, and displaying data in the companies. It uses enterprise reporting tools to organize data into charts, tables, widgets, or other visualizations. In this way, users can gain insights from the data and make data-driven decisions. .