Remove Dashboards Remove Data Integration Remove Data Warehouse Remove Publishing
article thumbnail

Enhance monitoring and debugging for AWS Glue jobs using new job observability metrics, Part 3: Visualization and trend analysis using Amazon QuickSight

AWS Big Data

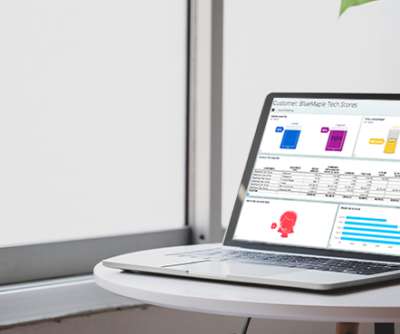
In Part 2 of this series, we discussed how to enable AWS Glue job observability metrics and integrate them with Grafana for real-time monitoring. Grafana provides powerful customizable dashboards to view pipeline health. QuickSight makes it straightforward for business users to visualize data in interactive dashboards and reports.

Metrics 110
article thumbnail

Reporting System: Everything You Need to Know

FineReport

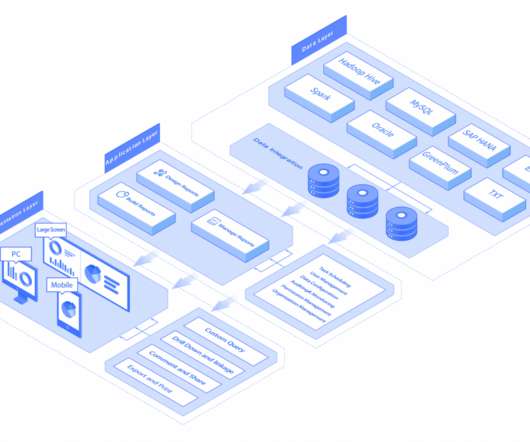
It is composed of three functional parts: the underlying data, data analysis, and data presentation. The underlying data is in charge of data management, covering data collection, ETL, building a data warehouse, etc. You can design, generate, and manage reports in this part.

Insiders

Sign Up for our Newsletter

This site is protected by reCAPTCHA and the Google Privacy Policy and Terms of Service apply.

Trending Sources

article thumbnail

Enterprise Reporting: The 2020’s Comprehensive Guide

FineReport

Then the reporting engine publishes these reports to the reporting portal to allow non-technical end-users access. In this way, users can gain insights from the data and make data-driven decisions. . The underlying data is responsible for data management, including data collection, ETL, building a data warehouse, etc.

article thumbnail

3-Tier Architecture: Everything You Need to Know

FineReport

The data layer of FineReport is responsible for data management, including data collection, ETL, building a data warehouse, etc. It supports multiple data sources and data integration. . FineReport is reporting software adopted the 3-tier architecture. .

article thumbnail

Dimensional modeling in Amazon Redshift

AWS Big Data

Amazon Redshift is a fully managed and petabyte-scale cloud data warehouse that is used by tens of thousands of customers to process exabytes of data every day to power their analytics workload. You can structure your data, measure business processes, and get valuable insights quickly can be done by using a dimensional model.

article thumbnail

How to Pinpoint Where Your Organization Wins (and Loses) with Data

CIO Business Intelligence

Here, I’ll highlight the where and why of these important “data integration points” that are key determinants of success in an organization’s data and analytics strategy. For data warehouses, it can be a wide column analytical table. Data and cloud strategy must align.

article thumbnail

How Tricentis unlocks insights across the software development lifecycle at speed and scale using Amazon Redshift

AWS Big Data

It has been well published since the State of DevOps 2019 DORA Metrics were published that with DevOps, companies can deploy software 208 times more often and 106 times faster, recover from incidents 2,604 times faster, and release 7 times fewer defects. Finally, data integrity is of paramount importance.