Remove Dashboards Remove Data Integration Remove Events Remove Visualization
article thumbnail

Mastering Data Visualization Jobs: Your Step-by-Step Career Guide

FineReport

Discovering the World of Data Visualization Jobs In today’s data-driven world, data visualization jobs play a crucial role in transforming complex information into visually appealing and easy-to-understand graphics. But what exactly are data visualization jobs, and why are they important?

article thumbnail

Create an Apache Hudi-based near-real-time transactional data lake using AWS DMS, Amazon Kinesis, AWS Glue streaming ETL, and data visualization using Amazon QuickSight

AWS Big Data

Change data capture (CDC) is one of the most common design patterns to capture the changes made in the source database and reflect them to other data stores. a new version of AWS Glue that accelerates data integration workloads in AWS. Then we can query the data with Amazon Athena visualize it in Amazon QuickSight.

Insiders

Sign Up for our Newsletter

This site is protected by reCAPTCHA and the Google Privacy Policy and Terms of Service apply.

article thumbnail

Introducing The Five Pillars Of Data Journeys

DataKitchen

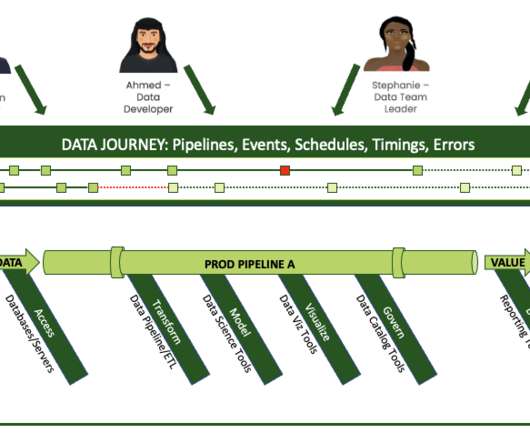
Initially, the infrastructure is unstable, but then we look at our source data and find many problems. Our customers start looking at the data in dashboards and models and then find many issues. Putting the data together with other data sets is another source of errors. Was it on time?

Testing 130
article thumbnail

10 Best Big Data Analytics Tools You Need To Know in 2023

FineReport

” This type of Analytics includes traditional query and reporting settings with scorecards and dashboards. Unlike traditional databases, processing large data volumes can be quite challenging. How to Choose the Right Big Data Analytics Tools? Having visually appealing graphics can also increase user adoption.

article thumbnail

The Superpowers of Ontotext’s Relation and Event Detector

Ontotext

This is part of Ontotext’s AI-in-Action initiative aimed at enabling data scientists and engineers to benefit from the AI capabilities of our products. Ontotext’s Relation and Event Detector (RED) is designed to assess and analyze the impact of market-moving events. Why do risk and opportunity events matter?

article thumbnail

HR Dashboard: Everything You Need To Know

FineReport

An HR dashboard functions as an advanced analytics tool that utilizes interactive data visualizations to present crucial HR metrics. Similar to various other business departments, human resources is gradually transforming into a data-centric function. What is an HR Dashboard?

article thumbnail

Daily Sales Report: Definition, Samples, Key Elements, and How-tos

FineReport

In order to meet the requirements on the style and design of reports in different scenarios, FineReport supports three different types of reports: Normal Report, Dashboard and Aggregation Report, which can generally cover different needs from different working scenarios. These reports are all produced by FineReport.

Sales 52