Remove Dashboards Remove Data Quality Remove Metrics Remove Visualization
article thumbnail

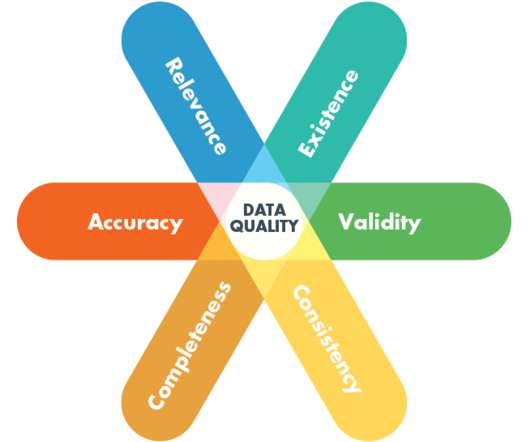
The Ultimate Guide to Modern Data Quality Management (DQM) For An Effective Data Quality Control Driven by The Right Metrics

datapine

1) What Is Data Quality Management? 4) Data Quality Best Practices. 5) How Do You Measure Data Quality? 6) Data Quality Metrics Examples. 7) Data Quality Control: Use Case. 8) The Consequences Of Bad Data Quality. 9) 3 Sources Of Low-Quality Data.

article thumbnail

Visualize data quality scores and metrics generated by AWS Glue Data Quality

AWS Big Data

AWS Glue Data Quality allows you to measure and monitor the quality of data in your data repositories. It’s important for business users to be able to see quality scores and metrics to make confident business decisions and debug data quality issues.

Insiders

Sign Up for our Newsletter

This site is protected by reCAPTCHA and the Google Privacy Policy and Terms of Service apply.

article thumbnail

SaaS Dashboard Examples For Modern Business Management Practices

datapine

If you’re part of a growing SaaS company and are looking to accelerate your success, leveraging the power of data is the way to gain a real competitive edge. That’s where SaaS dashboards enter the fold. A SaaS dashboard is a powerful business intelligence tool that offers a host of benefits for ambitious tech businesses.

article thumbnail

Financial Dashboard: Definition, Examples, and How-tos

FineReport

In today’s dynamic business environment, gaining comprehensive visibility into financial data is crucial for making informed decisions. This is where the significance of a financial dashboard shines through. What is A Financial Dashboard? You can download FineReport for free and have a try! Free Download of FineReport 1.

article thumbnail

Two Downs Make Two Ups: The Only Success Metrics That Matter For Your Data & Analytics Team

DataKitchen

So it’s Monday, and you lead a data analytics team of perhaps 30 people. But wait, she asks you for your team metrics. Like most leaders of data analytic teams, you have been doing very little to quantify your team’s success. Where is your metrics report? What should be in that report about your data team?

Metrics 130
article thumbnail

Introducing The Five Pillars Of Data Journeys

DataKitchen

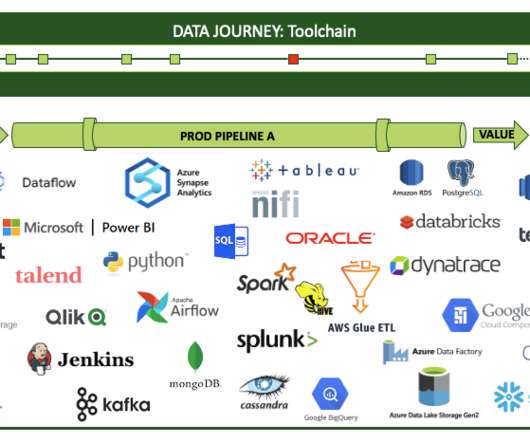
Another way to look at the five pillars is to see them in the context of a typical complex data estate. Initially, the infrastructure is unstable, but then we look at our source data and find many problems. Our customers start looking at the data in dashboards and models and then find many issues. Was it on time?

Testing 130
article thumbnail

Sport analytics leverage AI and ML to improve the game

CIO Business Intelligence

The platform uses ball-tracking cameras and 3D radar systems to generate live on-court match data, which is fed into Azure and combined with live score data to reveal insights into serving patterns, returns, and player movements around the court.

Analytics 118