Remove Dashboards Remove Data Warehouse Remove Demo Remove KPI
article thumbnail

Financial Dashboard: Definition, Examples, and How-tos

FineReport

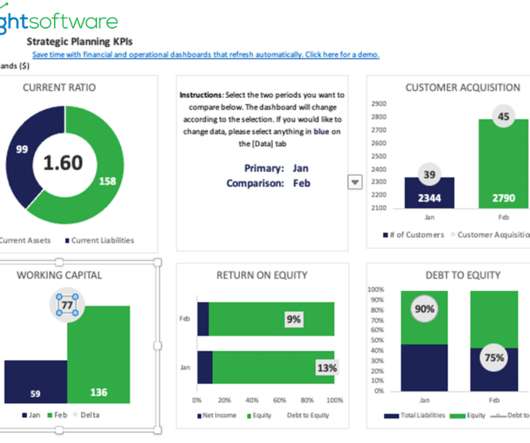
In today’s dynamic business environment, gaining comprehensive visibility into financial data is crucial for making informed decisions. This is where the significance of a financial dashboard shines through. What is A Financial Dashboard? You can download FineReport for free and have a try!

article thumbnail

An A-Z Data Adventure on Cloudera’s Data Platform

Cloudera

In this blog we will take you through a persona-based data adventure, with short demos attached, to show you the A-Z data worker workflow expedited and made easier through self-service, seamless integration, and cloud-native technologies. Company data exists in the data lake. The Data Scientist.

Insiders

Sign Up for our Newsletter

This site is protected by reCAPTCHA and the Google Privacy Policy and Terms of Service apply.

article thumbnail

Effective Report Design: a step-by-step guide

FineReport

e.g., If the topic is ‘income,’ the reports will involve the source of revenue, what factors affect income, income trends, whether KPI of the cycle can be achieved. . Determine the source of the data . Which database are the data from? Enterprise data warehouse? What database tables are the data from?

article thumbnail

Upcoming Power BI Workshop in Brisbane – 27 Mar 2015

Ms SQL Girl

Acquiring and Preparing Data for Power View and Excel. Data Modelling Patterns 101 using Power Pivot. Power Query 101 (for Power BI Dashboard). Tips and Tricks on Charts and Data Models. Publishing and Administering Dashboards and Reports in Power BI for the Organisation. Power Query 101 (For Power BI Dashboard).

article thumbnail

Upcoming Power BI Workshop in Huntington Beach, CA – Apr 10, 2015

Ms SQL Girl

Acquiring and Preparing Data for Power View and Excel. Data Modelling Patterns 101 using Power Pivot. Power Query 101 (for Power BI Dashboard). Tips and Tricks on Charts and Data Models. Publishing and Administering Dashboards and Reports in Power BI for the Organisation. Power Query 101 (For Power BI Dashboard).