article thumbnail

An A-Z Data Adventure on Cloudera’s Data Platform

Cloudera

In this blog we will take you through a persona-based data adventure, with short demos attached, to show you the A-Z data worker workflow expedited and made easier through self-service, seamless integration, and cloud-native technologies. Company data exists in the data lake. The Data Scientist.

article thumbnail

Financial Dashboard: Definition, Examples, and How-tos

FineReport

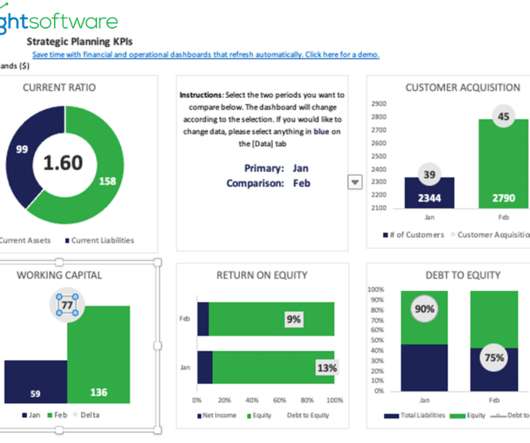
Financial KPI Dashboard The financial KPI dashboard aggregates vital performance indicators that hold significant importance in business analysis and decision-making. Finance and accounting teams often deal with data residing in multiple systems, such as accounting software, ERP systems, spreadsheets, and data warehouses.

Insiders

Sign Up for our Newsletter

This site is protected by reCAPTCHA and the Google Privacy Policy and Terms of Service apply.

article thumbnail

Effective Report Design: a step-by-step guide

FineReport

e.g., If the topic is ‘income,’ the reports will involve the source of revenue, what factors affect income, income trends, whether KPI of the cycle can be achieved. . Determine the source of the data . Which database are the data from? Enterprise data warehouse? What database tables are the data from?

article thumbnail

Upcoming Power BI Workshop in Brisbane – 27 Mar 2015

Ms SQL Girl

Her recent projects include delivering a SQL Server 2012 Data Warehouse and BI solutions for a number of high profile clients in the US and Australia. The first step before creating data visualisation using Power View and Pivot Tabes/Charts in Excel, we need to acquire the data from various data sources.

article thumbnail

Upcoming Power BI Workshop in Huntington Beach, CA – Apr 10, 2015

Ms SQL Girl

Her recent projects include delivering a SQL Server 2012 Data Warehouse and BI solutions for a number of high profile clients in the US and Australia. The first step before creating data visualization using Power View and Pivot Tables/Charts in Excel, we need to acquire the data from various data sources.