Remove Dashboards Remove Data Warehouse Remove Events Remove Visualization
article thumbnail

Centralize near-real-time governance through alerts on Amazon Redshift data warehouses for sensitive queries

AWS Big Data

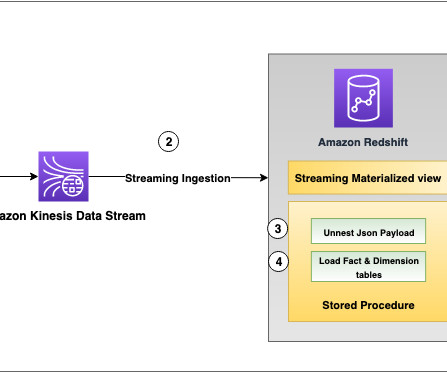
Amazon Redshift is a fully managed, petabyte-scale data warehouse service in the cloud that delivers powerful and secure insights on all your data with the best price-performance. With Amazon Redshift, you can analyze your data to derive holistic insights about your business and your customers.

article thumbnail

Visualize data quality scores and metrics generated by AWS Glue Data Quality

AWS Big Data

In this post, we highlight the seamless integration of Amazon Athena and Amazon QuickSight , which enables the visualization of operational metrics for AWS Glue Data Quality rule evaluation in an efficient and effective manner. The crawler builds a Data Catalog, so the data can be queried using Athena.

Insiders

Sign Up for our Newsletter

This site is protected by reCAPTCHA and the Google Privacy Policy and Terms of Service apply.

article thumbnail

Automate deployment of an Amazon QuickSight analysis connecting to an Amazon Redshift data warehouse with an AWS CloudFormation template

AWS Big Data

Amazon Redshift is the most widely used data warehouse in the cloud, best suited for analyzing exabytes of data and running complex analytical queries. Amazon QuickSight is a fast business analytics service to build visualizations, perform ad hoc analysis, and quickly get business insights from your data.

article thumbnail

What are decision support systems? Sifting data for better business decisions

CIO Business Intelligence

A DSS leverages a combination of raw data, documents, personal knowledge, and/or business models to help users make decisions. The data sources used by a DSS could include relational data sources, cubes, data warehouses, electronic health records (EHRs), revenue projections, sales projections, and more.

article thumbnail

How to get powerful and actionable insights from any and all of your data, without delay

Cloudera

By enabling their event analysts to monitor and analyze events in real time, as well as directly in their data visualization tool, and also rate and give feedback to the system interactively, they increased their data to insight productivity by a factor of 10. . Our solution: Cloudera Data Visualization.

article thumbnail

Architectural patterns for real-time analytics using Amazon Kinesis Data Streams, part 1

AWS Big Data

In this post, we will review the common architectural patterns of two use cases: Time Series Data Analysis and Event Driven Microservices. The collected data is available in milliseconds to allow real-time analytics use cases, such as real-time dashboards, real-time anomaly detection, and dynamic pricing.

Analytics 108
article thumbnail

Why your Data Visualization Platform should talk to Excel

InsightOut

It enables data visualization with its in-built charts feature, including popular chart types like bar graphs, pie charts, histograms, etc. Other more specialized data visualization tools make it even easier to access sophisticated features like real-time and interactive visualizations.