Remove Dashboards Remove Data Warehouse Remove Forecasting Remove IT
article thumbnail

Manage your data warehouse cost allocations with Amazon Redshift Serverless tagging

AWS Big Data

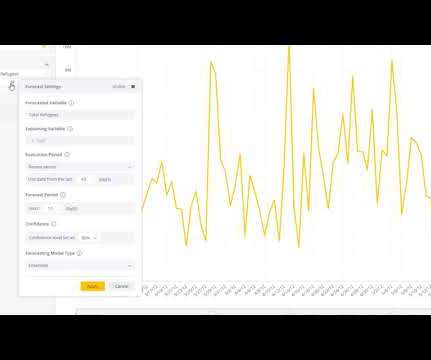
Amazon Redshift Serverless makes it simple to run and scale analytics without having to manage your data warehouse infrastructure. In Cost Explorer, you can visualize daily, monthly, and forecasted spend by combining an array of available filters. The number of tags applied to each resource is found in the Tags column.

article thumbnail

Get maximum value out of your cloud data warehouse with Amazon Redshift

AWS Big Data

Every day, customers are challenged with how to manage their growing data volumes and operational costs to unlock the value of data for timely insights and innovation, while maintaining consistent performance. As data workloads grow, costs to scale and manage data usage with the right governance typically increase as well.

Insiders

Sign Up for our Newsletter

This site is protected by reCAPTCHA and the Google Privacy Policy and Terms of Service apply.

article thumbnail

NetSuite adds generative AI to its entire ERP suite

CIO Business Intelligence

The company has also added new capabilities to its planning and budgeting feature to help enterprises automate data analysis for preparing budgets. The new capabilities were announced on Tuesday at the company’s annual SuiteWorld conference in Las Vegas. Both NetSuite Pay and NetSuite Electronic Invoicing are generally available.

IT 130
article thumbnail

6 BI challenges IT teams must address

CIO Business Intelligence

Every day, organizations of every description are deluged with data from a variety of sources, and attempting to make sense of it all can be overwhelming. By 2025, it’s estimated we’ll have 463 million terabytes of data created every day,” says Lisa Thee, data for good sector lead at Launch Consulting Group in Seattle.

IT 130
article thumbnail

Financial Dashboard: Definition, Examples, and How-tos

FineReport

In today’s dynamic business environment, gaining comprehensive visibility into financial data is crucial for making informed decisions. This is where the significance of a financial dashboard shines through. What is A Financial Dashboard? You can download FineReport for free and have a try!

article thumbnail

Using Business Intelligence in Demand Forecasting

Jet Global

One of those areas is called predictive analytics, where companies extract information from existing data to determine buying patterns and forecast future trends. By using a combination of data, statistical algorithms, and machine learning techniques, predictive analytics identifies the likelihood of future outcomes based on the past.

article thumbnail

Sisense Q2 2021: Build Extensible Insights and Infuse Analytics Beyond the Dashboard

Sisense

Infusing intelligence everywhere is where Sisense shines, which is why in Q2 we’ve invested in bringing you Infusion Apps that leverage our brand new Extense Framework along with other features that allow you to explore new dimensions of your data. Optimize your cloud data warehouse cost forecasting. Learn more.