article thumbnail

Digital KPIs: The secret to measuring transformational success

CIO Business Intelligence

Regardless of where organizations are in their digital transformation, CIOs must provide their board of directors, executive committees, and employees definitions of successful outcomes and measurable key performance indicators (KPIs). He suggests, “Choose what you measure carefully to achieve the desired results.

article thumbnail

An Introduction To Data Dashboards: Meaning, Definition & Industry Examples

datapine

Enter data dashboards – one of history’s best innovations in business intelligence. To help you understand this notion in full, we’re going to explore a data dashboard definition, explain the power of dashboard data, and explore a selection of data dashboard examples. What Is A Data Dashboard? click to enlarge**.

Insiders

Sign Up for our Newsletter

This site is protected by reCAPTCHA and the Google Privacy Policy and Terms of Service apply.

article thumbnail

Deploy Amazon QuickSight dashboards to monitor AWS Glue ETL job metrics and set alarms

AWS Big Data

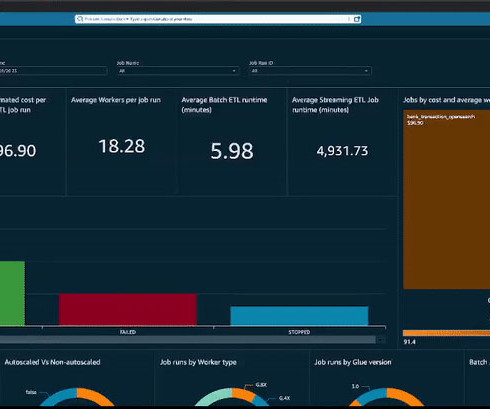
You have metrics available per job run within the AWS Glue console, but they don’t cover all available AWS Glue job metrics, and the visuals aren’t as interactive compared to the QuickSight dashboard. In the following sections, we show you how to set up the solution, explore the dashboards, and configure alarms.

Metrics 91
article thumbnail

Business Intelligence Dashboard (BI Dashboard): Best Practices and Examples

FineReport

With the advent of Business Intelligence Dashboard (BI Dashboard), access to information is no longer limited to IT departments. A BI dashboard is becoming an essential strategic mechanism for businesses. Note: The Business Intelligence Dashboard (BI Dashboard) examples shown in this article are developed by FineReport.

article thumbnail

Dashboard Metrics: Your KPI Guidelines and Practices

FineReport

As technology advances, the use of data-driven dashboards is becoming increasingly important. Metrics dashboards enable you and your team to track the effectiveness of various tactics, campaigns, and processes. Dashboard metrics from FineReport. What is dashboard metrics. It uses a performance metrics dashboard.

KPI 52
article thumbnail

10 Best Dashboard Design Tips, Templates & How-To’s

FineReport

The most predominant means to visualize data is the application of various dashboards. The dashboard design has naturally become an important point that cannot be ignored. Many people are not very confident in designing an effective dashboard. Dashboard Design Tips. Sales dashboard by FineReport.

article thumbnail

A Data-Driven Guide To Skyrocket Your Year Over Year Growth

datapine

YoY growth is an effective means of measuring your ongoing progress and making sure your business is moving in the right direction. Year over year growth is a KPI that allows you to measure and benchmark your progress against a comparison period of 12 months before. That’s where year over year (YoY) growth enters the mix.