Remove Dashboards Remove Interactive Remove Reporting Remove Scorecard
article thumbnail

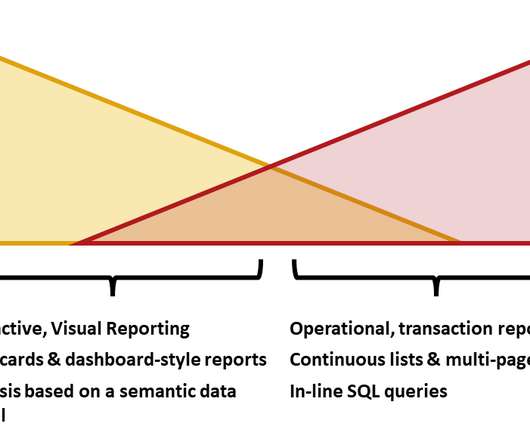
When to Use Paginated Reports vs Interactive Power BI reports

Paul Turley

The road that has brought us to the current state of reporting capabilities in the Microsoft data platform has been long and winding. Ten years ago, we were using SQL Server Reporting Services (SSRS) to create interactive, dashboard-like reports scorecard reports.

article thumbnail

A Complete Guide To Driving Digital Transformation In Marketing

datapine

An accounting department may consider leveraging electronic contracts, data collecting, and reporting as a part of the digital transition. Several marketing dashboard tools allow you to generate automated online dashboards and reports to track your most relevant KPIs in one place. Interactivity-driven Social Marketing.

Insiders

Sign Up for our Newsletter

This site is protected by reCAPTCHA and the Google Privacy Policy and Terms of Service apply.

article thumbnail

AWS Professional Services scales by improving performance and democratizing data with Amazon QuickSight

AWS Big Data

Enabling teams to build their own analyses at scale The Insights team builds dashboards and supports thousands of internal consultants and hundreds of analysts and engineers across the globe who drive local products and insights. Last year, this team also reported over 29,600 distinct views on their 19 dashboards.

article thumbnail

A Guide To The Top 14 Types Of Reports With Examples Of When To Use Them

datapine

Table of Contents 1) What Is The Report Definition? 2) Top 14 Types Of Reports 3) What Does A Report Look Like? Businesses have been producing reports since, forever. This presents a problem for many modern organizations today as building reports can take from hours to days. What Is The Report Definition?

Reporting 201
article thumbnail

10 Best Big Data Analytics Tools You Need To Know in 2023

FineReport

” This type of Analytics includes traditional query and reporting settings with scorecards and dashboards. FineReport FineReport is a powerful reporting and big data tool that adopts popular 3-tier architecture. The most distinct is its reporting capabilities. Offers interactive and shared dashboards.

article thumbnail

10 Ways That Corporate Dashboards Can Make Your Enterprise Life Easier

datapine

Whatever your sector or niche, if you want to remain adaptable and get one step ahead of the competition, working with the right data-driven tools and utilizing a corporate dashboard is essential. That’s where corporate dashboards come in. Your Chance: Want to create your own dynamic corporate dashboard? 1) CFO dashboard.

article thumbnail

PODCAST: Making AI Real – Episode 3: Empowering HR Organizations with Automated Business Surveillance Systems

bridgei2i

Sunil: Monica, in today’s scenario, the organizations have scorecards to track KPIs across businesses, geographies, and functions through BI dashboards and Excel reports. How do you track and report the impact of these metrics on key business outcomes? So, what’s your take on this? SERIES: Making AI Real.