Remove Dashboards Remove Key Performance Indicator Remove Measurement Remove Modeling
article thumbnail

SaaS Dashboard Examples For Modern Business Management Practices

datapine

That’s where SaaS dashboards enter the fold. A SaaS dashboard is a powerful business intelligence tool that offers a host of benefits for ambitious tech businesses. Exclusive Bonus Content: Your Definitive Guide to SaaS & Dashboards! Geet our bite-sized free summary and start building your dashboards!

article thumbnail

Financial Dashboard: Definition, Examples, and How-tos

FineReport

This is where the significance of a financial dashboard shines through. In this article, we will explore the concept of a financial dashboard, highlight its numerous benefits, and provide various kinds of financial dashboard examples for you to employ and explore. What is A Financial Dashboard?

Insiders

Sign Up for our Newsletter

This site is protected by reCAPTCHA and the Google Privacy Policy and Terms of Service apply.

article thumbnail

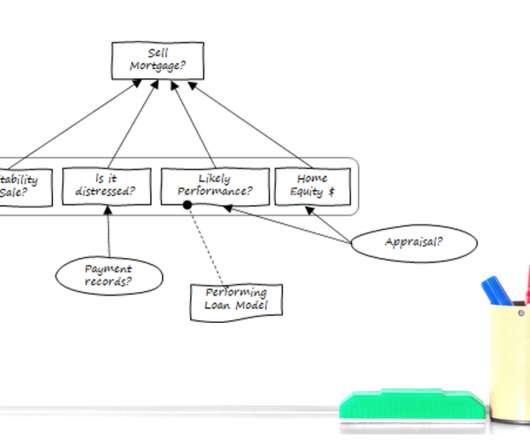
Make Your Investment in Analytic Technology Pay Off With Decision Requirements Modeling

Decision Management Solutions

Like many enterprises, you’ve likely made a hefty investment in analytic technology—from interactive dashboards and advanced visualization tools to data mining, predictive analytics, machine learning (ML), and artificial intelligence (AI). Focusing on decision-making changes everything. We can show you how to accomplish this. Get started.

article thumbnail

Best CFO KPIs and Dashboards for the 2021 CFO

Jet Global

A CFO Key Performance Indicator (KPI) or metric is a quantifiable high level measure of financial performance. These performance metrics can also be used to measure a company’s financial performance relative to competitors in the same industry. What KPIs Should be in a CFO’s Dashboard?

article thumbnail

Two Downs Make Two Ups: The Only Success Metrics That Matter For Your Data & Analytics Team

DataKitchen

How to measure your data analytics team? Under Velocity, the Mean Time to Deliver Data metric measures the time it takes to deliver data. The Data Change Request Ratio metric measures the rate of business demand for data. The Mean Time to Recovery metric measures how quickly defects can be resolved. Introduction.

Metrics 130
article thumbnail

What is Integrated Business Planning (IBP)?

IBM Big Data Hub

Continuous monitoring and performance management Integrated Business Planning is an ongoing process that requires continuous monitoring of performance against plans and targets. Key performance indicators (KPIs) are established to measure progress and enable proactive management.

article thumbnail

Take Advantage Of Operational Metrics & KPI Examples – A Comprehensive Guide

datapine

But first, let’s begin with a general understanding of key metrics and their usage in business. What gets measured gets done.” – Peter Drucker. Business metrics are used to evaluate performance, compare results, and track relevant data to improve business outcomes. Who will measure it?

KPI 269