article thumbnail

Bridging the Gap: How ‘Data in Place’ and ‘Data in Use’ Define Complete Data Observability

DataKitchen

Moreover, advanced metrics like Percentage Regional Sales Growth can provide nuanced insights into business performance. Data in Use pertains explicitly to how data is actively employed in business intelligence tools, predictive models, visualization platforms, and even during export or reverse ETL processes.

Testing 169
article thumbnail

Introducing The Five Pillars Of Data Journeys

DataKitchen

Our customers start looking at the data in dashboards and models and then find many issues. Did the Airflow job complete before the dashboard was loaded? It involves tracking key metrics such as system health indicators, performance measures, and error rates and closely scrutinizing system logs to identify anomalies or errors.

Testing 130
Insiders

Sign Up for our Newsletter

This site is protected by reCAPTCHA and the Google Privacy Policy and Terms of Service apply.

Trending Sources

article thumbnail

What is business analytics? Using data to improve business outcomes

CIO Business Intelligence

Data analytics is used across disciplines to find trends and solve problems using data mining , data cleansing, data transformation, data modeling, and more. Business analytics also involves data mining, statistical analysis, predictive modeling, and the like, but is focused on driving better business decisions.

article thumbnail

Are You Harnessing the Power of SaaS BI Tools for Dynamic Data Access?

FineReport

When combined, SaaS BI tools enable users to conduct comprehensive data analysis using modern cloud BI technology , providing access to all data sources and the ability to compile online dashboards from mobile devices. Tableau , developed by Salesforce, is another prominent player in the realm of SaaS BI software.

article thumbnail

Keys to Data Fluency: Matching Tools to User Needs

Juice Analytics

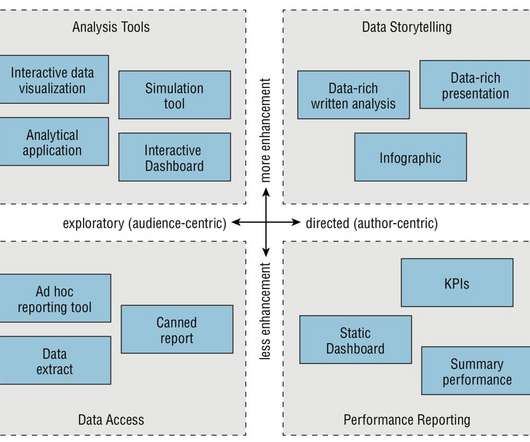
There are many choices: Dashboards Reports Self-service BI tools Predictive models One-off analyses using slides Spreadsheet models It is a confusing array of ways to deliver data to these data consumers. How much will the raw data be enhanced with analysis, modeling, and pre-digested insights?

article thumbnail

Embedded BI Can Encourage Data Literacy!

Smarten

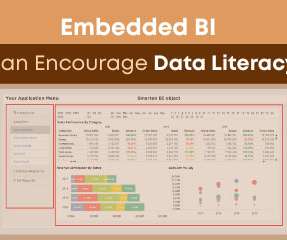
Embedded BI and Augmented Analytics includes traditional BI components like dashboards, KPIs, Reports with interactive drill-down, drill through, slice and dice and self-serve analytics capabilities.

article thumbnail

Automating the Automators: Shift Change in the Robot Factory

O'Reilly on Data

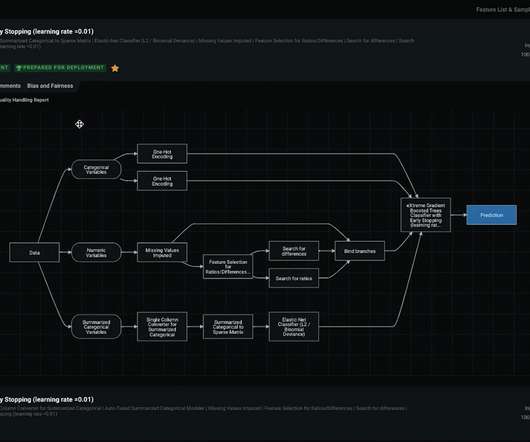
Building Models. A common task for a data scientist is to build a predictive model. You’ll try this with a few other algorithms, and their respective tuning parameters–maybe even break out TensorFlow to build a custom neural net along the way–and the winning model will be the one that heads to production.