article thumbnail

Financial Dashboard: Definition, Examples, and How-tos

FineReport

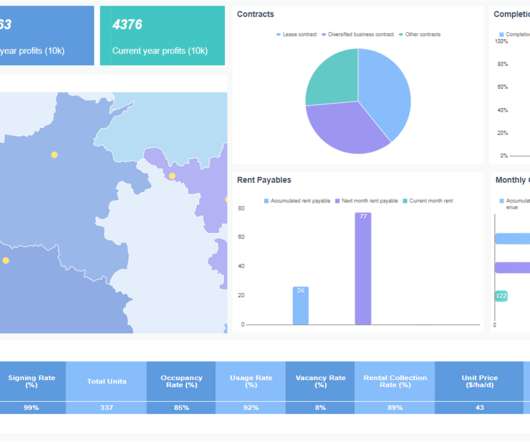
Financial Performance Dashboard The financial performance dashboard provides a comprehensive overview of key metrics related to your balance sheet, shedding light on the efficiency of your capital expenditure. While sales dashboards focus on future prospects, accounting primarily focuses on analyzing the same metrics retrospectively.

article thumbnail

Financial Reporting & Financial Analysis: Definitive Guide

FineReport

However, companies operation generates numerous and complicated data every day, beyond traditional manual reporting capacity. The underlying idea is to find the differences between goals and actual results by comparing corresponding metrics. Data Collection and Report Drawing. The personal version is free. Free Trial.

Insiders

Sign Up for our Newsletter

This site is protected by reCAPTCHA and the Google Privacy Policy and Terms of Service apply.

article thumbnail

A Beginner’s Guide to Financial Report: Definition, Types, Tools & Templates

FineReport

This guide is designed for beginners to learn the definition, types, tools, and templates of financial reports. For example, it is more suitable to provide a non-professional reader with a financial report with key financial indicators instead of an entire financial report with all detailed metrics. Step 2: Collect financial data.

article thumbnail

The Lean Analytics Cycle: Metrics > Hypothesis > Experiment > Act

Occam's Razor

To win in business you need to follow this process: Metrics > Hypothesis > Experiment > Act. We are far too enamored with data collection and reporting the standard metrics we love because others love them because someone else said they were nice so many years ago. That metric is tied to a KPI.

Metrics 156
article thumbnail

EU Cookie / Privacy Laws: Implications On Data Collection And Analysis

Occam's Razor

The way data is collected online and what happens to it is a much-scrutinized issue (and rightly so). Digital data collection is also exceedingly complex, perhaps a reflection of the organic nature, and subsequent explosion, of the internet. Web Data Collection Context: Cookies and Tools. La vita è bella.

article thumbnail

My top learning moments at Splunk.conf23

Rocket-Powered Data Science

Here are four specific metrics from the report, highlighting the potentially huge enterprise system benefits coming from implementing Splunk’s observability and monitoring products and services: Four times as many leaders who implement observability strategies resolve unplanned downtime in just minutes, not hours or days.

article thumbnail

What Is Rum data and why does it matter?

IBM Big Data Hub

Are there alternatives to RUM data? Does that imply that there are “fake” user metrics as well? Synthetic data is where algorithms and simulations attempt to create the experience of an “average” user based on representative data samples. Synthetic data is a statistical representation of reality.

IT 68