Remove Data Collection Remove Definition Remove Measurement Remove Metrics
article thumbnail

Financial Dashboard: Definition, Examples, and How-tos

FineReport

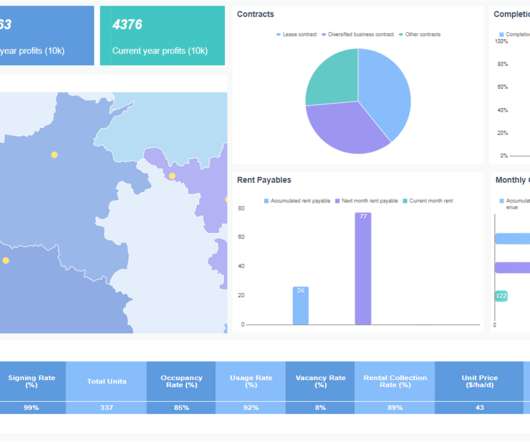
Financial Performance Dashboard The financial performance dashboard provides a comprehensive overview of key metrics related to your balance sheet, shedding light on the efficiency of your capital expenditure.

article thumbnail

A Beginner’s Guide to Financial Report: Definition, Types, Tools & Templates

FineReport

This guide is designed for beginners to learn the definition, types, tools, and templates of financial reports. For example, it is more suitable to provide a non-professional reader with a financial report with key financial indicators instead of an entire financial report with all detailed metrics. Step 2: Collect financial data.

Insiders

Sign Up for our Newsletter

This site is protected by reCAPTCHA and the Google Privacy Policy and Terms of Service apply.

article thumbnail

Financial Reporting & Financial Analysis: Definitive Guide

FineReport

However, companies operation generates numerous and complicated data every day, beyond traditional manual reporting capacity. The underlying idea is to find the differences between goals and actual results by comparing corresponding metrics. Profit analysis: measure the company’s operating profit and profit distribution.

article thumbnail

Top Productivity Metrics Examples & KPIs To Measure Performance And Outcomes

datapine

1) What Are Productivity Metrics? 2) How To Measure Productivity? 3) Productivity Metrics Examples. 4) The Value Of Workforce Productivity Metrics. For years, businesses have experimented and narrowed down the most effective measurements for productivity. What Are Productivity Metrics? Table of Contents.

article thumbnail

The Lean Analytics Cycle: Metrics > Hypothesis > Experiment > Act

Occam's Razor

To win in business you need to follow this process: Metrics > Hypothesis > Experiment > Act. We are far too enamored with data collection and reporting the standard metrics we love because others love them because someone else said they were nice so many years ago. That metric is tied to a KPI.

Metrics 156
article thumbnail

EU Cookie / Privacy Laws: Implications On Data Collection And Analysis

Occam's Razor

The way data is collected online and what happens to it is a much-scrutinized issue (and rightly so). Digital data collection is also exceedingly complex, perhaps a reflection of the organic nature, and subsequent explosion, of the internet. Web Data Collection Context: Cookies and Tools. La vita è bella.

article thumbnail

Utilize The Undeniable Power Of Professional COO Dashboards & Reports

datapine

But let’s start from the beginning and explain basic definitions. A COO (chief operating officer) dashboard is a visual management tool used by COOs to connect multiple data sources, track, evaluate, and help COOs to optimize operational processes within a company by using interactive metrics and advanced analytical capabilities.