Remove Data Collection Remove Demo Remove Metrics Remove Reporting
article thumbnail

25 Best Healthcare KPIs and Metric Examples for 2021 Reporting

Jet Global

A healthcare Key Performance Indicator (KPI) or metric is a well-defined performance measure that is used to observe, analyze, optimize, and transform a healthcare process to increase satisfaction for both patients and healthcare providers alike. While this metric is very useful, it is also very general. What is a Healthcare KPI?

Metrics 98
article thumbnail

Financial Reporting & Financial Analysis: Definitive Guide

FineReport

This article shows you a comprehensive guide on Financial Reporting and Financial Analysis and illustrates how to use them appropriately. . What is Financial Reporting? As the name suggests, financial reporting is a method of compilation and reproduction of crucial financial data in a structured and readable manner.

Insiders

Sign Up for our Newsletter

This site is protected by reCAPTCHA and the Google Privacy Policy and Terms of Service apply.

Trending Sources

article thumbnail

Everything You Need to Know About Project Management Dashboard

FineReport

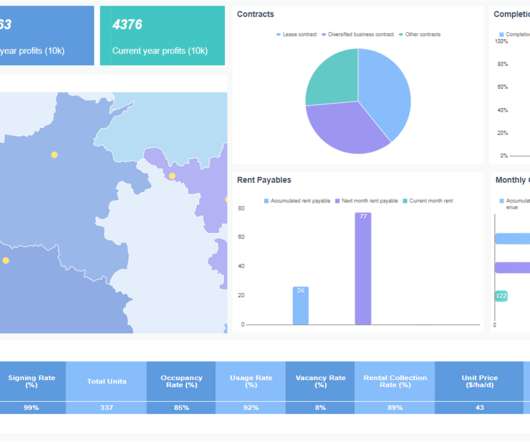
Additionally, these dashboards provide customized reports that offer a swift overview of project status, simplifying resource optimization and time management. Project management dashboards employ a diverse range of visual elements, including graphs, charts, and other representations, to visualize project data.

article thumbnail

Digital Transformation in the Office of the CFO: Predictions for 2020 and Beyond

Jet Global

This includes tools that automatically pull data from across an enterprise organization, in real time, and organize that data into easy-to-read CFO reports and CFO dashboards. Automated data collection, for example, can be used to deliver faster information and insights to customers in real time.

article thumbnail

Financial Dashboard: Definition, Examples, and How-tos

FineReport

A financial dashboard, one of the most important types of data dashboards , functions as a business intelligence tool that enables finance and accounting teams to visually represent, monitor, and present financial key performance indicators (KPIs). These reports include the cash flow statement, income statement, and balance sheet.

article thumbnail

How Data Analytics Helps Understand Customers During the Onboarding Process

Smart Data Collective

The three biggest enemies to user onboarding are the lack of data analysis, data collection, and the wrong amount of information. Unfortunately, many businesses worldwide are not doing a good job collecting data and thus, fail to enhance customer relationships. Pay attention to the metrics.

article thumbnail

Autoscaling Deployment with MLOps

DataRobot Blog

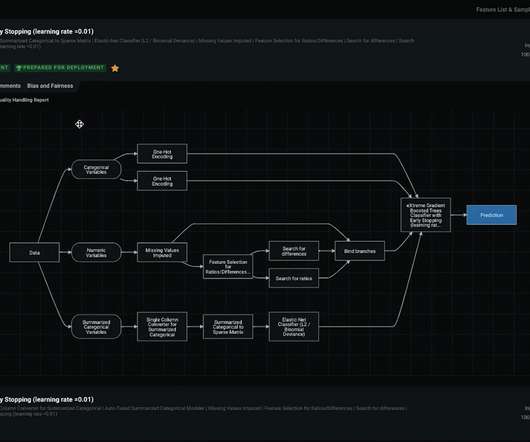
In this technical post, we’ll focus on some changes we’ve made to allow custom models to operate as an algorithm on Algorithmia, while still feeding predictions, input, and other metrics back to the DataRobot MLOps platform —a true best of both worlds. Data Science Expertise Meets Scalability.

Metrics 52