Remove Data Processing Remove Interactive Remove Reference Remove Visualization
article thumbnail

Move Beyond Excel, PowerPoint And Static Business Reporting with Powerful Interactive Dashboards

datapine

Visualizing the data and interacting on a single screen is no longer a luxury but a business necessity. That’s why we welcome you to the world of interactive dashboards. But before we delve into the bits and pieces of our topic, let’s answer the basic questions: What is an interactive dashboard, and why you need one?

article thumbnail

The Top 20 Data Visualization Books That Should Be On Your Bookshelf

datapine

Now that you’re sold on the power of data analytics in addition to data-driven BI, it’s time to take your journey a step further by exploring how to effectively communicate vital metrics and insights in a concise, inspiring, and accessible format through the power of visualization. They can be fun and interactive, too.

Insiders

Sign Up for our Newsletter

This site is protected by reCAPTCHA and the Google Privacy Policy and Terms of Service apply.

Trending Sources

article thumbnail

A Guide to the Best Javascript Visualization Libraries

Sisense

JavaScript data visualization tools are in greater demand now than ever before because of the enormous growth of data. Marketing , finance , and sales teams all rely on visualizations to help them understand their data. Understanding Javascript data visualization libraries.

article thumbnail

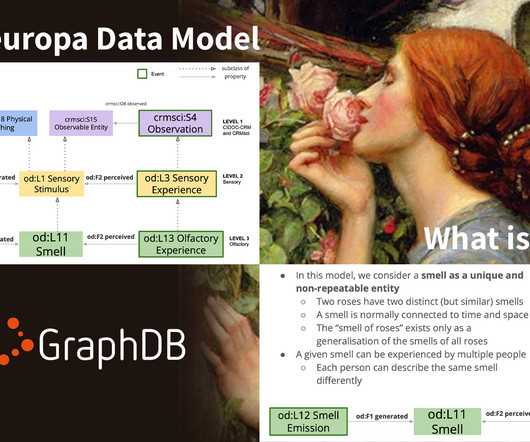
GraphDB in Action: Smells Like Semantics Spirit

Ontotext

As knowledge graphs have made their way into more and more areas of our lives through smarter search and immersive information navigation, they are also gradually turning into the default way we expect to interact with knowledge. But what about questions related to intangibles? van Erp, M., Bembibre, C., and Leemans, I.

article thumbnail

11 Examples of Good & Bad Data Storytelling

Juice Analytics

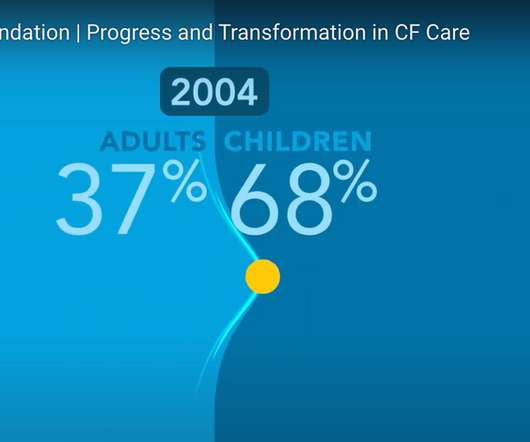
The good examples in this list demonstrate how to combined data visualization, interactivity, and classic storytelling. Graphicacy & Cystic Fibrosis Foundation This data story combines pictures, voice-over, and animated data visualizations to create a compelling narrative. of data stories gone wrong.

article thumbnail

Your Introduction To CFO Dashboards & Reports In The Digital Age

datapine

Serving as a central, interactive hub for a host of essential fiscal information, CFO dashboards host dynamic financial KPIs and intuitive analytical tools, as well as consolidate data in a way that is digestible and improves the decision-making process. Your Chance: Want to build your own CFO dashboard completely free?
article thumbnail

Your Modern Business Guide To Data Analysis Methods And Techniques

datapine

To help you understand the potential of analysis and how you can use it to enhance your business practices, we will answer a host of important analytical questions. Arguably, the best way to make your data analysis concepts accessible across the organization is through data visualization. Visualize your data.