article thumbnail

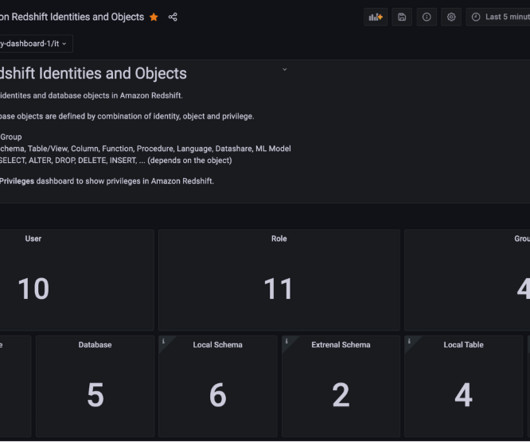
Visualize database privileges on Amazon Redshift using Grafana

AWS Big Data

Amazon Redshift is a fully managed, petabyte-scale data warehouse service in the cloud. Amazon Redshift enables you to use SQL for analyzing structured and semi-structured data with best price performance along with secure access to the data. Grafana provides a predefined dashboard to visualize database privileges.

article thumbnail

SAP Datasphere Powers Business at the Speed of Data

Rocket-Powered Data Science

Data collections are the ones and zeroes that encode the actionable insights (patterns, trends, relationships) that we seek to extract from our data through machine learning and data science. This is where SAP Datasphere (the next generation of SAP Data Warehouse Cloud) comes in.

Insiders

Sign Up for our Newsletter

This site is protected by reCAPTCHA and the Google Privacy Policy and Terms of Service apply.

article thumbnail

How to enable Cloudera Data Visualization in CDW

Cloudera

In our previous blog post we introduced Cloudera Data Visualization in Cloudera Data Warehouse (CDW) available in tech preview, in CDP Public Cloud. This blog will help you get started with Cloudera Data Visualization, so you can start building interesting and powerful applications on all types of data.

article thumbnail

Breaking barriers in geospatial: Amazon Redshift, CARTO, and H3

AWS Big Data

However, visualizing and analyzing large-scale geospatial data presents a formidable challenge due to the sheer volume and intricacy of information. This often overwhelms traditional visualization tools and methods. Figure 1 – Map built with CARTO Builder and the native support to visualize H3 indexes What are spatial indexes?

article thumbnail

Bridge the Gap Between Reporting and Data Visualization in Power BI

Jet Global

Business intelligence is a key tool, empowering companies to get the most out of their data by providing tools to analyze information, streamline operations, track performance, and inform decision-making. Power BI can generate easy-to-read visualizations that help stakeholders perform key analysis.

article thumbnail

How a Discovery Data Warehouse, the next evolution of augmented analytics, accelerates treatments and delivers medicines safely to patients in need

Cloudera

For example, it includes patient samples (blood, blood pressure, temperature, and more), patient information (age, gender, where they have lived, family situation, and other details), and treatment history, most of which is currently found only in paper documents. The Vision of a Discovery Data Warehouse.

article thumbnail

How Dafiti made Amazon QuickSight its primary data visualization tool

AWS Big Data

Data and its various uses is increasingly evident in companies, and each professional has their preferences about which technologies to use to visualize data, which isn’t necessarily in line with the technological needs and infrastructure of a company. In this post, we discuss why we chose QuickSight and how we implemented it.