Remove Data Warehouse Remove KPI Remove Metrics Remove Reporting
article thumbnail

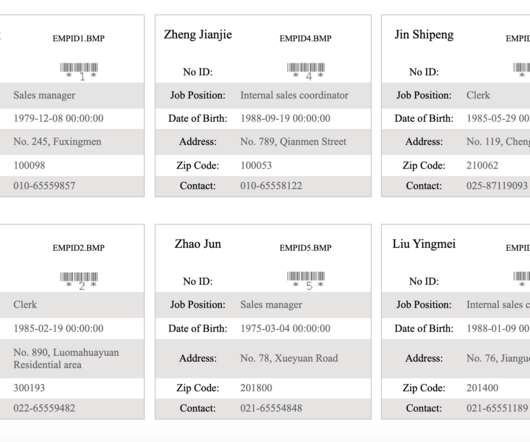
Effective Report Design: a step-by-step guide

FineReport

The design of reports can be considered from two aspects: layout and system. You may have seen many articles emphasize how to improve the layout of the report. Today, let’s learn the report designing from the perspective of the report system. The Basics of Report Designing . The Basics of Report Designing .

article thumbnail

Top 10 Types of Report: Examples and How to Design

FineReport

Reports are the basic business requirements of an enterprise. It can help enterprises make better use of data if different data can be presented by appropriate reports. Top 10 Types of Report. Detail Report. Top 10 Types of Report. Detail Report. Group Report. Pagination Report.

Insiders

Sign Up for our Newsletter

This site is protected by reCAPTCHA and the Google Privacy Policy and Terms of Service apply.

Trending Sources

article thumbnail

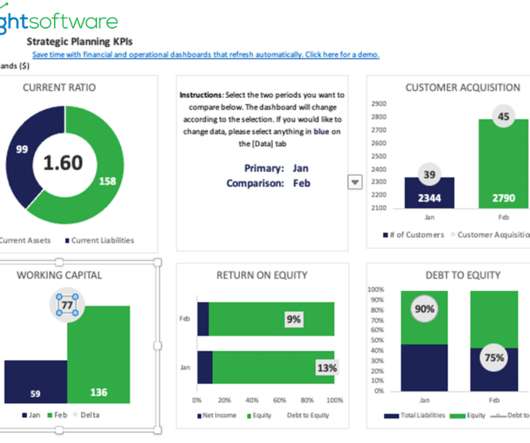
Financial Dashboard: Definition, Examples, and How-tos

FineReport

A financial dashboard, one of the most important types of data dashboards , functions as a business intelligence tool that enables finance and accounting teams to visually represent, monitor, and present financial key performance indicators (KPIs). These reports include the cash flow statement, income statement, and balance sheet.

article thumbnail

Common Business Intelligence Challenges Facing Entrepreneurs

datapine

In addition to increasing the price of deployment, setting up these data warehouses and processors also impacted expensive IT labor resources. The ROI alone from hours saved and reduced costs of producing current reports will improve your bottom line. At a small business, a data culture may not exist yet.

article thumbnail

A Guide To Starting A Career In Business Intelligence & The BI Skills You Need

datapine

Being able to clearly see how the data changes in time is what makes it possible to extract relevant conclusions from it. For this purpose, you should be able to differentiate between various charts and report types as well as understand when and how to use them to benefit the BI process. Business Intelligence Job Roles.

article thumbnail

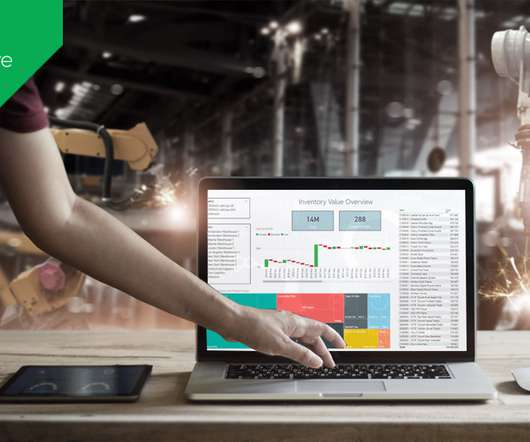
The 10 Best Business Intelligence Tools For Small And Big Business

Smart Data Collective

A BI tool can collect, analyze, and convert data for you into easily comprehensible reports. For this reason, businesses of every scale have tons of metrics they monitor, organize and analyze. In many cases, data processing includes manual data entrance , painful hours of calculations and stats drafting.

article thumbnail

What Is Ad Hoc Reporting? Your Guide To Definition, Meaning, Examples & Benefits

datapine

With the rate of available data growing exponentially, it’s crucial to work with the right online reporting tools to not only segment, curate, and analyze large data sets but also uncover answers to new questions that you didn’t even know existed. Your Chance: Want to benefit from modern ad hoc reporting?

Reporting 260