Remove Definition Remove Measurement Remove Snapshot Remove Visualization
article thumbnail

Chart Snapshot: Functional Box Plots

The Data Visualisation Catalogue

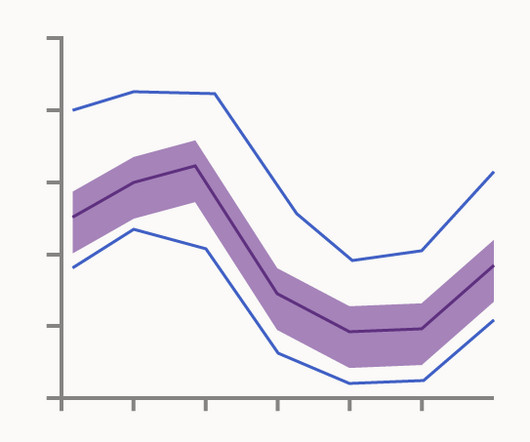
While this visualisation technique is a variation of the classic Box Plot , a Functional Box Plot is visually very different and instead plots a combination of lines and areas to communicate the various data ranges. This allows for the definition of functional quantiles and the identification of central and outlying observations.

article thumbnail

Your Definitive Guide To KPI Tracking By Utilizing Modern Software & Tools

datapine

KPI tracking is a definitive means of monitoring your most relevant key performance indicators for increased business success with the help of modern KPI software. By measuring KPIs regularly and automatically, you can increase productivity and decrease costs. . We offer a 14 day free trial. Benefit from a great tracking system today!

KPI 195
Insiders

Sign Up for our Newsletter

This site is protected by reCAPTCHA and the Google Privacy Policy and Terms of Service apply.

article thumbnail

Your Definitive Guide To Building Valuable Narratives Through Data Storytelling

datapine

By gaining centralized access to business data and presenting it in a visual way that follows a logical path and provides invaluable insights on a particular area or subject, you stand to set yourself apart from your competitors and become a leader in your field. Exclusive Bonus Content: Your definitive guide to data storytelling!

KPI 193
article thumbnail

Financial Dashboard: Definition, Examples, and How-tos

FineReport

A financial dashboard, one of the most important types of data dashboards , functions as a business intelligence tool that enables finance and accounting teams to visually represent, monitor, and present financial key performance indicators (KPIs).

article thumbnail

What is a KPI Report? Definition, Examples, and How-tos

FineReport

Key Performance Indicators (KPIs) serve as vital metrics that help measure progress towards business goals. A KPI report, also known as KPI reporting, serves as a management tool for measuring, organizing, and analyzing the primary key performance indicators that are vital to a business.

KPI 52
article thumbnail

Getting Started With Incremental Sales – Best Practices & Examples

datapine

Without further ado, let’s get started, first with the incremental sales definition. Incremental Sales Calculation As mentioned, incremental sales are used by businesses as a key performance indicator to measure the financial success of their promotional efforts. What Are Incremental Sales? Keep reading to find out!

Sales 176
article thumbnail

Take Advantage Of The Top 16 Sales Graphs And Charts To Boost Your Business

datapine

This gives to that sales graph an overall sense of visual contrast which makes it much more digestible at a glance. A definitive sales graph example for any growing organization. Number 6 on our list is a sales graph example that offers a detailed snapshot of sales conversion rates. click to enlarge**. 6) Sales Conversion.

Sales 235