article thumbnail

How to Build a Free Cash Flow Dashboard, with Downloadable Template

Jet Global

They have that designation because companies have discovered a direct correlation between the trajectory of these metrics and their own success or failure. The free cash flow metric focuses on one crucial aspect of finance that has an outsized impact on a company’s strategic agenda. Free cash flow is one of the most important.

article thumbnail

How To Interact With Power BI Data In A PowerPoint Presentation

Smart Data Collective

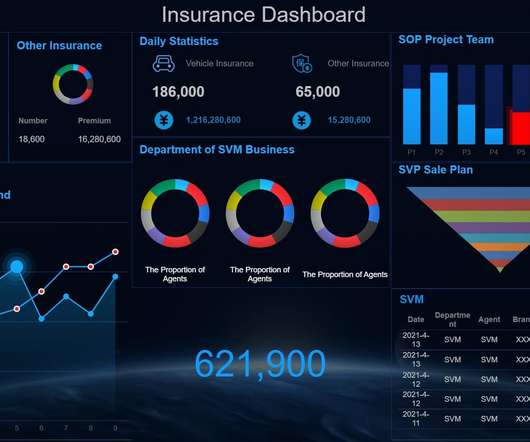
Microsoft Power BI is a Business Intelligence and Data Visualization tool which assists organizations to analyze data from multiple sources, convert it into an interactive dashboard and share insights. You can embed the interactive visuals seamlessly with existing off and on cloud premises like PowerPoint, MailChimp and Word.
Insiders

Sign Up for our Newsletter

This site is protected by reCAPTCHA and the Google Privacy Policy and Terms of Service apply.

Trending Sources

article thumbnail

These Top 3 Email Metrics Tools Are Made Possible By Big Data Analytics

Smart Data Collective

Email productivity is intrinsically linked to your productivity as a whole, and studying your email metrics using email metrics tools is the only way to make improvements. A subtle improvement in your own habits could lead to massive time savings, both for you and the people you interact with. Workload and scheduling.

Metrics 73
article thumbnail

Monitoring Cloudera DataFlow Deployments With Prometheus and Grafana

Cloudera

It allows developers to interactively design data flows in a drag and drop designer, which can be deployed as continuously running, auto-scaling flow deployments or event-driven serverless functions. In this blog we will dive into how CDF-PC’s support for NiFi reporting tasks can be used to monitor key metrics in Prometheus and Grafana.

Metrics 108
article thumbnail

Omnichannel is Multichannel 2.0

Download this guide and receive: An interactive flowchart to assess where you are in your omnichannel journey. A unique case-study, complete with hard metrics and step-by-step process breakdown. A roadmap for those who want to transition from multichannel to omnichannel marketing.

article thumbnail

Getting Started With Strategic & Operational Reports

datapine

Download: A pocket-sized guide to operational and strategic reports! Operational reporting is an effective, results-driven means of tracking, measuring and analyzing a business’s regular deliverables and metrics, usually on a daily, weekly, and sometimes monthly basis with the help of modern and professional BI reporting tools.

article thumbnail

A 12-Point Checklist for Public and Open Data Sites (with Examples)

Juice Analytics

Too many open data sites simply provide downloadable access to the data. Interactive, exploratory visualizations give your visitors a playground to find their own insights in the data. Explain your metrics For many public data sites that are focused on a particular topic, there will be a few key measures of performance.