Remove Forecasting Remove Metrics Remove Modeling Remove Testing
article thumbnail

Error Metrics: How to Evaluate Your Forecasts

Jedox

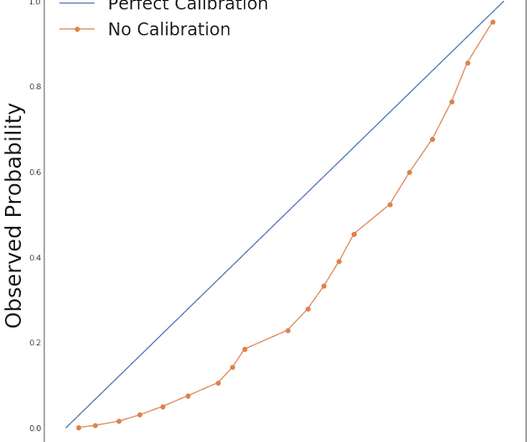
When considering the performance of any forecasting model, the prediction values it produces must be evaluated. This is done by calculating suitable error metrics. An error metric is a way to quantify the performance of a model and provides a way for the forecaster to quantitatively compare different models 1.

article thumbnail

Defining clear metrics to drive model adoption and value creation

Domino Data Lab

It’s often stated that nothing changes inside an enterprise because you’ve built a model. In some cases, data science does generate models directly to revenue, such as a contextual deal engine that targets people with offers that they can instantly redeem. But what about good decisions?

Metrics 93
Insiders

Sign Up for our Newsletter

This site is protected by reCAPTCHA and the Google Privacy Policy and Terms of Service apply.

Trending Sources

article thumbnail

Bringing an AI Product to Market

O'Reilly on Data

Product Managers are responsible for the successful development, testing, release, and adoption of a product, and for leading the team that implements those milestones. The first step in building an AI solution is identifying the problem you want to solve, which includes defining the metrics that will demonstrate whether you’ve succeeded.

Marketing 361
article thumbnail

Automating Model Risk Compliance: Model Validation

DataRobot Blog

Last time , we discussed the steps that a modeler must pay attention to when building out ML models to be utilized within the financial institution. In summary, to ensure that they have built a robust model, modelers must make certain that they have designed the model in a way that is backed by research and industry-adopted practices.

Risk 52
article thumbnail

What is business analytics? Using data to improve business outcomes

CIO Business Intelligence

Research firm Gartner defines business analytics as “solutions used to build analysis models and simulations to create scenarios, understand realities, and predict future states.”. Data analytics is used across disciplines to find trends and solve problems using data mining , data cleansing, data transformation, data modeling, and more.

article thumbnail

Interview with: Sankar Narayanan, Chief Practice Officer at Fractal Analytics

Corinium

Fractal’s recommendation is to take an incremental, test and learn approach to analytics to fully demonstrate the program value before making larger capital investments. It is also important to have a strong test and learn culture to encourage rapid experimentation. Therefore, understanding customers for cross and up-sell is paramount.

Insurance 250
article thumbnail

DirectX Visualization Optimizes Analytics Algorithmic Traders

Smart Data Collective

Let’s dive right into how DirectX visualization can boost analytics and facilitate testing for you as an Algo-trader, quant fund manager, etc. So, how can DirectX visualization improve your analytics and testing as a trader? For instance, they display trend lines, pivot points, low volatility and other metrics in distinct colors.