article thumbnail

Build Up Your Performance With KPI Scorecards – Examples & Templates

datapine

In fact, data has become the raw material that every business decision is based on while reporting tools create the environment to act on generated information swiftly and accurately. Tracking the success metrics based on your needs, and the time frame you select while comparing your values can be done with simple yet effective scorecards.

Scorecard 226
article thumbnail

Dashboard vs. Scorecard: Differences, Advantages, Templates

FineReport

As important parts of business intelligence, scorecards and dashboards can both play an obvious role in promoting enterprise performance management. However, many users are confused with the difference between scorecard vs. dashboard. Definition of scorecard and dashboard. What is a scorecard? What is a dashboard?

Insiders

Sign Up for our Newsletter

This site is protected by reCAPTCHA and the Google Privacy Policy and Terms of Service apply.

Trending Sources

article thumbnail

Scorecard vs Dashboard: How to Choose to Maximize Your Benefits?

FineReport

As important parts of business intelligence, scorecard and dashboard can both play an obvious role in promoting enterprise development. However, limited by factors such as cost and corporate strategies, sometimes companies need to make a choice between scorecard vs dashboard. Definition of scorecard and dashboard.

article thumbnail

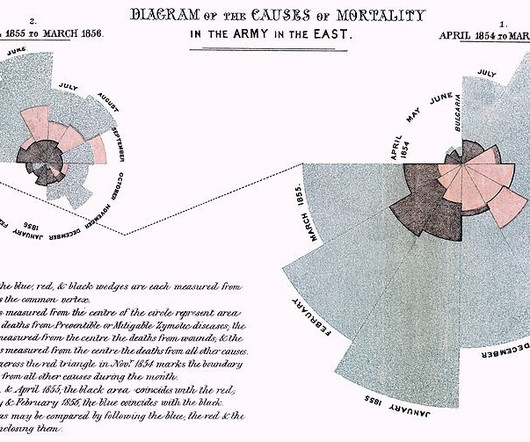
A Brief History of Data Visualization

Jet Global

Editors note: This blog was originally published in October 2013, and has been completely revamped and updated for accuracy, relevancy, and comprehensiveness in September 2019 Prior to the 17th century, data visualization existed mainly in the realm of maps, displaying land markers, cities, roads, and resources.

article thumbnail

Explore The Power & Potential Of Professional Social Media Dashboards

datapine

Gathering data and information from one or multiple platforms and creating a comprehensive social media dashboard is equally important as creating the social content itself. To make the most out of your social media dashboards, you need to have an established process before you generate reports and utilize your online data visualization.

article thumbnail

Visualize data quality scores and metrics generated by AWS Glue Data Quality

AWS Big Data

AWS Glue Data Quality generates a substantial amount of operational runtime information during the evaluation of rulesets. An operational scorecard is a mechanism used to evaluate and measure the quality of data processed and validated by AWS Glue Data Quality rulesets. In the following sections, we discuss these steps in more detail.

article thumbnail

13 power tips for Microsoft Power BI

CIO Business Intelligence

Power BI is Microsoft’s interactive data visualization and analytics tool for business intelligence (BI). You can drill into data, create a variety of visualizations, and (literally) ask questions about it using AI. Here’s how to get more insights from the information you already have, in more areas than you might expect.