Remove Insurance Remove Metrics Remove Modeling Remove Visualization
article thumbnail

Interview with: Sankar Narayanan, Chief Practice Officer at Fractal Analytics

Corinium

I am the Chief Practice Officer for Insurance, Healthcare, and Hi-Tech verticals at Fractal. The Insurance practice is currently engaged with several top 10 P&C insurers in the US, across the Insurance value chain through AI, Engineering, Design & Behavioural Sciences programs.

Insurance 250
article thumbnail

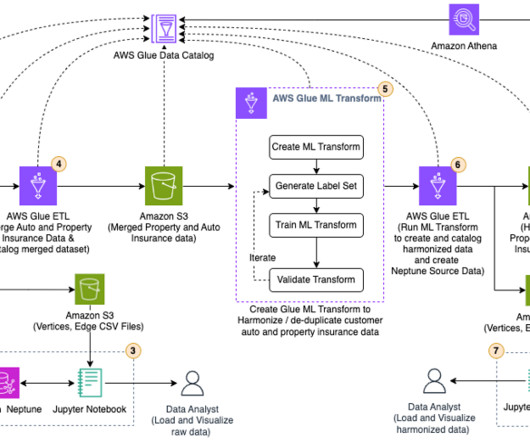
Harmonize data using AWS Glue and AWS Lake Formation FindMatches ML to build a customer 360 view

AWS Big Data

We use Amazon Neptune to visualize the customer data before and after the merge and harmonization. Overview of solution In this post, we go through the various steps to apply ML-based fuzzy matching to harmonize customer data across two different datasets for auto and property insurance.

Insiders

Sign Up for our Newsletter

This site is protected by reCAPTCHA and the Google Privacy Policy and Terms of Service apply.

article thumbnail

80% of insurance carriers aren’t delivering high impact analytics. Here’s how you can do better.

Decision Management Solutions

80% of data and analytics leaders with global life insurance and property & casualty carriers surveyed by McKinsey reported that their analytics investments are not delivering high impact. Begin with an agile analytic deployment platform, not with visualization. What’s stopping them from delivering high impact?

article thumbnail

Simple Tricks To Up-level Your Analytics Reports.

Occam's Razor

Just yesterday I was quietly seething because none of visuals included in the report contained any context to understand if the performance I was looking at was good or bad. Know the difference between Metrics & KPIs. A metric is a number. A KPI is a metric that helps you understand how you are doing against your objectives!

Reporting 113
article thumbnail

The Ultimate Guide To Enterprise Business Intelligence(BI)

FineReport

Organizations of all sizes and stages can use BI software to analyze, manage, and visualize business data. Enterprise business intelligence collects these metrics data and displays them in a real-time manner. Based on business data, BI visualizes business problems through graphics and models.

article thumbnail

AWS Glue Data Quality is Generally Available

AWS Big Data

Data engineers must then write code to monitor data pipelines, visualize quality scores, and alert them when anomalies occur. Rule Type Description AggregateMatch Checks if two datasets match by comparing summary metrics like total sales amount. This simple pricing model doesn’t lock you into annual licenses.

article thumbnail

Building AI with AutoML and Composable ML

DataRobot

As they strive to improve models, data scientists continually try new approaches to refine their predictions. After adding the preferred code, teams can take advantage of the existing DataRobot capabilities, such as metrics, explainability, visualizations, deployment, monitoring, collaboration, and governance. So let’s dig in!