Remove Interactive Remove Presentation Remove Statistics Remove Visualization
article thumbnail

Master Data Visualization Techniques: A Comprehensive Guide

FineReport

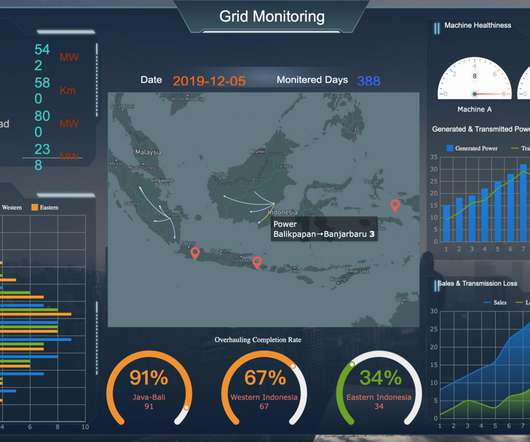
Data visualization techniques are paramount in today’s data-driven world. Mastering data visualization techniques is not just a skill but a necessity for professionals across various industries. Definition and Importance Visualizing data involves representing information through graphical elements like charts and graphs.

article thumbnail

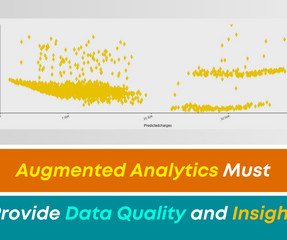
Augmented Analytics Must Provide Data Quality and Insight!

Smarten

What you need are apps and solutions that allow you to ask easy questions in your own words and receive guidance and recommendations on how to best visualize and present your data and what techniques to use to gain the most insight. These measures empower them with a deeper understanding of their data like never before.

Insiders

Sign Up for our Newsletter

This site is protected by reCAPTCHA and the Google Privacy Policy and Terms of Service apply.

Trending Sources

article thumbnail

A Guide To Starting A Career In Business Intelligence & The BI Skills You Need

datapine

For example, if you enjoy computer science, programming, and data but are too extroverted to program all day long, you could work in a more human-oriented area of intelligence for business, perhaps involving more face-to-face interactions than most programmers would encounter on the job.

article thumbnail

A Guide To The Methods, Benefits & Problems of The Interpretation of Data

datapine

Through the art of streamlined visual communication, data dashboards permit businesses to engage in real-time and informed decision-making and are key instruments in data interpretation. The interpretation of data is designed to help people make sense of numerical data that has been collected, analyzed, and presented.

article thumbnail

What is data science? Transforming data into value

CIO Business Intelligence

Data science is a method for gleaning insights from structured and unstructured data using approaches ranging from statistical analysis to machine learning. For example, data analysts should be on board to investigate the data before presenting it to the team and to maintain data models. What is data science?

article thumbnail

Data Visualization Is Not a Panacea

Perceptual Edge

It galls me when people oversell data visualization. Data visualization combines technologies (visual representations of quantitative data) with specific skills (techniques for creating and interacting with those visual representations) to make sense of and communicate quantitative data.

article thumbnail

Your Definitive Guide To Building Valuable Narratives Through Data Storytelling

datapine

Stories inspire, engage, and have the unique ability to transform statistical information into a compelling narrative that can significantly enhance business success. According to a study performed by Skyword, content that features a mix of words and visuals drives 34% more engagement than text-only articles, blog posts, or whitepapers.

KPI 193