Remove Interactive Remove Snapshot Remove Software Remove Visualization
article thumbnail

Your Definitive Guide To KPI Tracking By Utilizing Modern Software & Tools

datapine

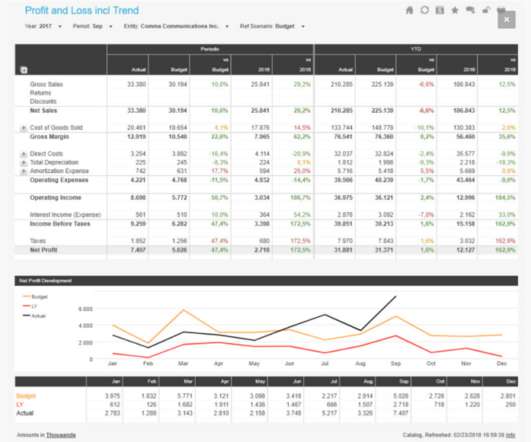
Your Chance: Want to test a professional KPI tracking software for free? KPI tracking is a definitive means of monitoring your most relevant key performance indicators for increased business success with the help of modern KPI software. KPI tracking software gives businesses the tools to set informed goals and benchmarks.

KPI 195
article thumbnail

Your Introduction To CFO Dashboards & Reports In The Digital Age

datapine

Serving as a central, interactive hub for a host of essential fiscal information, CFO dashboards host dynamic financial KPIs and intuitive analytical tools, as well as consolidate data in a way that is digestible and improves the decision-making process. In this case, financial analytics software might help. What Is A CFO Dashboard?

Insiders

Sign Up for our Newsletter

This site is protected by reCAPTCHA and the Google Privacy Policy and Terms of Service apply.

article thumbnail

iostudio delivers key metrics to public sector recruiters with Amazon QuickSight

AWS Big Data

We wanted to include interactive, real-time visualizations to support recruiters from one of our government clients. Our previous solution offered visualization of key metrics, but point-in-time snapshots produced only in PDF format. We also saved 75% on our annual external software costs.

Metrics 96
article thumbnail

10 Examples of How Big Data in Logistics Can Transform The Supply Chain

datapine

The rise of SaaS business intelligence tools is answering that need, providing a dynamic vessel for presenting and interacting with essential insights in a way that is digestible and accessible. Your Chance: Want to test a professional logistics analytics software? Your Chance: Want to test a professional logistics analytics software?

Big Data 275
article thumbnail

Top 10 Management Reporting Best Practices To Create Effective Reports

datapine

When these reports are backed up with powerful visualizations developed with a dashboard creator , no information can stay hidden, eliminating thus the possibility of human errors and negative business impact. 4) Make your report visually pleasing through focus. Who are my most profitable clients?

Reporting 263
article thumbnail

Take Advantage Of The Top 16 Sales Graphs And Charts To Boost Your Business

datapine

This gives to that sales graph an overall sense of visual contrast which makes it much more digestible at a glance. Number 6 on our list is a sales graph example that offers a detailed snapshot of sales conversion rates. 8) Revenue And Sales Interactive Management Overview. click to enlarge**. 6) Sales Conversion.

Sales 235
article thumbnail

Your Definitive Guide To Building Valuable Narratives Through Data Storytelling

datapine

By gaining centralized access to business data and presenting it in a visual way that follows a logical path and provides invaluable insights on a particular area or subject, you stand to set yourself apart from your competitors and become a leader in your field. Download our free executive summary and start creating your stories!

KPI 193