Remove Key Performance Indicator Remove Manufacturing Remove Metrics Remove Strategy
article thumbnail

30 Best Manufacturing KPIs and Metric Examples for 2021 Reporting

Jet Global

An Operations Key Performance Indicator (KPI) or metric is a discrete measurement that a company uses to monitor and evaluate the efficiency of its day-to-day operations. These operations KPIs help management identify which operational strategies are effective, and those that inhibit the company. Manufacturing.

Metrics 131
article thumbnail

How to build a successful product development strategy

IBM Big Data Hub

A finely tuned product development strategy is a holistic, cross-collaborative endeavor with the capacity to help any organization weather unforeseen events or market changes. Why is a strong product development strategy important? Consumers have access to more information than ever to compare products and brands.

Insiders

Sign Up for our Newsletter

This site is protected by reCAPTCHA and the Google Privacy Policy and Terms of Service apply.

article thumbnail

Two Downs Make Two Ups: The Only Success Metrics That Matter For Your Data & Analytics Team

DataKitchen

But wait, she asks you for your team metrics. You spend all day helping your customers leverage analytics for improved business performance, so why are you so un-analytic about how you run your data analytics teams? Where is your metrics report? Forty-five metrics! You’ve got a new boss. What should I track?

Metrics 130
article thumbnail

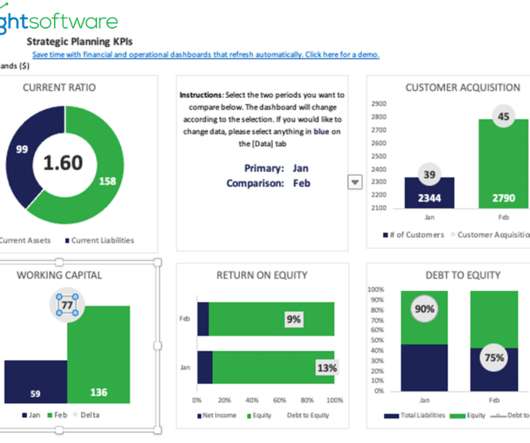
A Complete Guide On How To Set Smart KPI Targets And Goals

datapine

That said, there are various methods and tools businesses use to manage their data and optimize their performance. One of the most powerful ones being key performance indicators (KPIs). In short, these two progress measurements work together as part of a whole business strategy. What Are KPI Targets?

KPI 152
article thumbnail

Your Ultimate Guide To Modern KPI Reports In The Digital Age – Examples & Templates

datapine

Typically presented in the form of an interactive dashboard , this kind of report provides a visual representation of the data associated with your predetermined set of key performance indicators – or KPI data, for short. We’ve covered key performance indicators in addition to the power and importance of these kinds of reports.

KPI 223
article thumbnail

Best Dashboard Ideas & Design Examples To Boost Your Business Success

datapine

A cool dashboard is not only visually pleasing, but it also offers a level of logical organization that makes it easier to drill down into specific key performance indicators (KPIs), trends, or patterns. 5) Employee Performance Dashboard. 13) Manufacturing Cost Management Dashboard. Landing Page Conversion Rates.

article thumbnail

Discover The Power Of Modern Performance Reports – See Examples & Best Practices 

datapine

2) The Importance of Performance Reports 3) Performance Report Examples 4) Performance Reporting Tips Performance reporting has been a traditional business practice for decades now. With this 360-view, decision-makers can extract insights to inform their strategies and boost business growth.

Reporting 207