article thumbnail

How AWS helped Altron Group accelerate their vision for optimized customer engagement

AWS Big Data

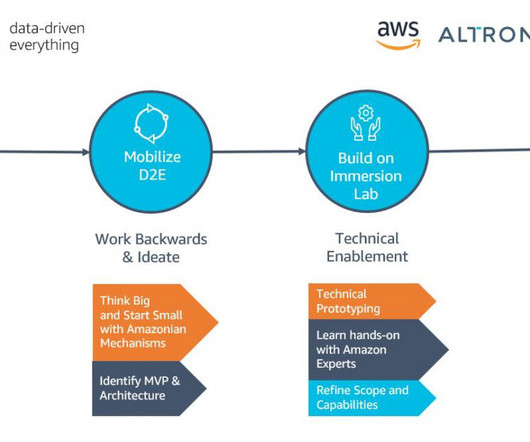
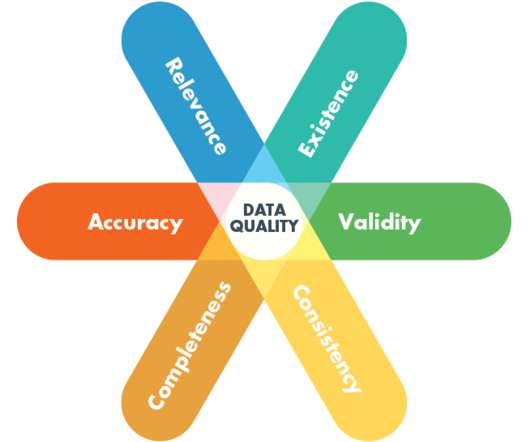
Alongside their partner AWS, they participated in AWS Data-Driven Everything (D2E) workshops and a bespoke AWS Immersion Day workshop that catered to their needs to improve their engagement with their customers. Data quality for account and customer data – Altron wanted to enable data quality and data governance best practices.

article thumbnail

9 Habits of Data Fluent Organizations — and How to Learn Them

Juice Analytics

With our book , resources and workshops, we’ve shared guidance about what it takes to become a data fluent organization. Habit 1: Define shared metrics Data fluency requires getting everyone on the same page as to what matters most. For difficult choices, we have shared baseline: How will it impact our North Star Metric?

Metrics 119
Insiders

Sign Up for our Newsletter

This site is protected by reCAPTCHA and the Google Privacy Policy and Terms of Service apply.

article thumbnail

Meta-Learning For Better Machine Learning

Rocket-Powered Data Science

So, you start by assuming a value for k and making random assumptions about the cluster means, and then iterate until you find the optimal set of clusters, based upon some evaluation metric. There are several choices for such evaluation metrics: Dunn index, Davies-Bouldin index, C-index, and Silhouette analysis are just a few examples.

article thumbnail

Elevate Your Protection Strategy at CSO’s Future of Cybersecurity Summit

CIO Business Intelligence

Metrics that create a narrative and show how the business compares to competitors, the wider industry, and globally against all businesses give a clear picture that allows board members to set strategy. They want something that’s going to punch them in the face,” he said.

Strategy 123
article thumbnail

12 Rules for Data Storytelling

Juice Analytics

Or maybe you don’t have the time to attend a world-class data storytelling workshop ? The choices you make — the metrics and visualization you choose, the sequence of content, even how you label the data — these are all an expression of your priorities and insights into the data. No problem. Part 1: Think Like a Storyteller.

Metrics 138
article thumbnail

Improve reliability and reduce costs of your Apache Spark workloads with vertical autoscaling on Amazon EMR on EKS

AWS Big Data

The data, fetched from the Kubernetes Metric Server, feeds into statistical models that VPA constructs in order to build recommendations. In short, vertical autoscaling sets up VPA to track the container_memory_working_set_bytes metric for the Spark executor pods that have vertical autoscaling enabled.

Metrics 75
article thumbnail

11 Data Presentation Tips and Resources to Deliver More Client Value

Juice Analytics

She has musings on her blog and outstanding workshops such as “3 Keys Every Data Practitioner Needs to Confidently Present Insights and Inspire Action”. Show that you can be nimble with your data while guiding your audience with the right metrics and visualizations that will deliver insights.