article thumbnail

Introduction to Statistics Using the R Programming Language

Analytics Vidhya

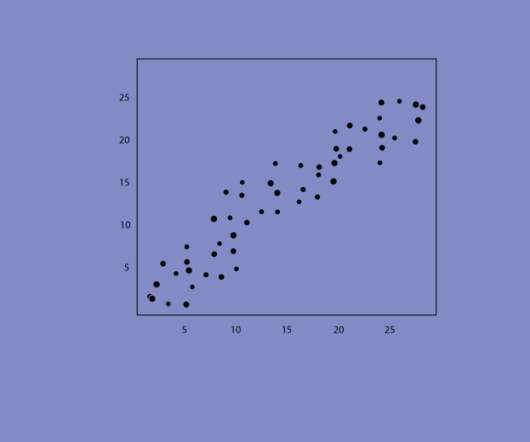
R, an open-source tool, empowers data enthusiasts to explore, analyze, and visualize data with precision. Whether you’re delving into descriptive statistics, probability distributions, or sophisticated regression models, R’s versatility and extensive packages facilitate seamless statistical exploration.

article thumbnail

Creating Linear Model, It’s Equation and Visualization for Analysis

Analytics Vidhya

Introduction Have you ever been tasked with visualizing the relationship between each. The post Creating Linear Model, It’s Equation and Visualization for Analysis appeared first on Analytics Vidhya. This article was published as a part of the Data Science Blogathon.

Insiders

Sign Up for our Newsletter

This site is protected by reCAPTCHA and the Google Privacy Policy and Terms of Service apply.

article thumbnail

Remove Your Rose Tinted Glasses: Data Visualizations Designed to Mislead

datapine

1) Misleading Data Visualization Examples. 2) How to Avoid Misleading Visuals. 3) The Impact Of Bad Data Visualizations. But while that may be the case, people are duped by data visualizations every day. Bad data visualizations come in many forms, with some more obvious than others. Table of Contents.

article thumbnail

From Raw Data to Visualization: Marvel Social Graph Analysis

Smart Data Collective

Marvel is one of the many companies using big data to optimize its business model. What’s amazing is that Marvel characters are developed through the influence of other Marvel heroes through data visualization. For instance, when Spider-Man appears in a comic book with Captain America, these are all visualized through data graphics.

article thumbnail

Complete R Tutorial To Build Probabilistic Graphical Models!

Analytics Vidhya

Introduction: Probabilistic Graphical Models (PGM) capture the complex relationships between random variables. The post Complete R Tutorial To Build Probabilistic Graphical Models! This article was published as a part of the Data Science Blogathon. appeared first on Analytics Vidhya.

Modeling 306
article thumbnail

What is a data architect? Skills, salaries, and how to become a data framework master

CIO Business Intelligence

The data architect is responsible for visualizing and designing an organization’s enterprise data management framework. Application data architect: The application data architect designs and implements data models for specific software applications. In some ways, the data architect is an advanced data engineer.

article thumbnail

What is business analytics? Using data to improve business outcomes

CIO Business Intelligence

Business analytics is the practical application of statistical analysis and technologies on business data to identify and anticipate trends and predict business outcomes. Data analytics is used across disciplines to find trends and solve problems using data mining , data cleansing, data transformation, data modeling, and more.