
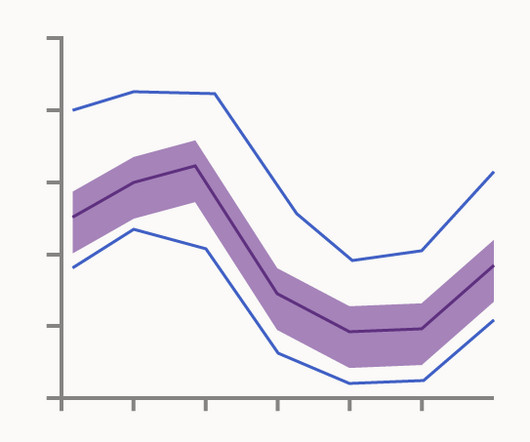
Chart Snapshot: Functional Box Plots
The Data Visualisation Catalogue
APRIL 26, 2024
This region provides a robust measure of the spread of the central 50% of the curves. Median Curve: The median curve represents the most central observation and serves as a robust statistic for centrality. 2012, Environmetrics, 23: 54-64. Outlier Detection: Outliers can be identified using an empirical rule based on 1.5


Let's personalize your content