article thumbnail

Create Modern SQL Dashboards With Professional Tools & Software

datapine

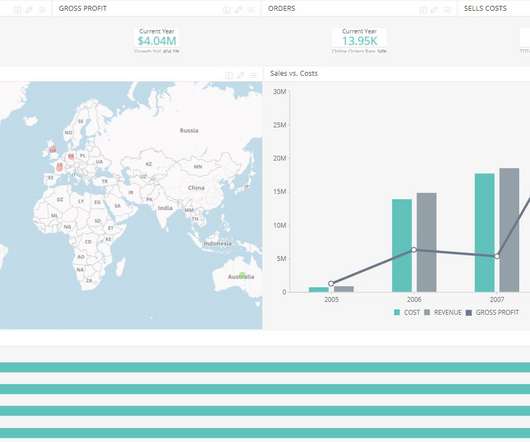
The good news is that you can utilize both with the help of a modern and professional SQL dashboard. That said, in this post, we will take a detailed look into what is a SQL dashboard, how to create one (or several), and provide you with visual examples that will represent the undeniable power that SQL has on offer.

article thumbnail

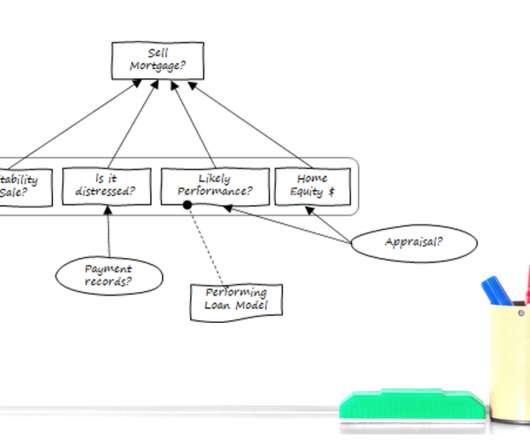
Make Your Investment in Analytic Technology Pay Off With Decision Requirements Modeling

Decision Management Solutions

Like many enterprises, you’ve likely made a hefty investment in analytic technology—from interactive dashboards and advanced visualization tools to data mining, predictive analytics, machine learning (ML), and artificial intelligence (AI). 1 MIT Sloan Management Review September 06, 2017. Focusing on decision-making changes everything.

Insiders

Sign Up for our Newsletter

This site is protected by reCAPTCHA and the Google Privacy Policy and Terms of Service apply.

article thumbnail

Operational Finance in the Age of Covid-19: Time to Change the Basics?

Jet Global

And it’s possible to become lost in the minutiae of the many different metrics available to measure an organisation’s AR capabilities. Instead, continuous reporting, in which information is updated in real time on easy-to-read dashboards, means finance teams will always have the latest figures at their fingertips.

Finance 98
article thumbnail

The Very Best Digital Metrics For 15 Different Companies!

Occam's Razor

There is no golden metric for everyone, we are all unique snowflakes! :). and tell you what are the best key performance indicators (metrics) for them. In the past I’ve shared a cluster of metrics that small, medium and large businesses can use as a springboard…. If you want to play along. Don’t read what I’ve chosen.

Metrics 141
article thumbnail

Don’t Start from Scratch! Make One of these Dashboards Instead

Depict Data Studio

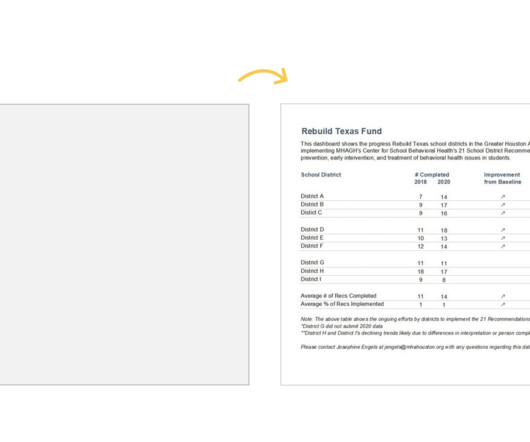
Dashboards aren’t supposed to take forever. Dashboards are supposed to be fast and easy. In this article, you’ll see examples of real dashboards that you can use as inspiration for your own workplace. Adapt one of these dashboards instead. They’re not supposed to cost an arm and a leg. That’s it!

article thumbnail

How Sisense Engineered Its Cloud-Native Linux Deployment From the Ground Up

Sisense

As of 2017, Linux was running 90% of the public cloud workload. Given this importance, we made it an organizational priority to invest in a Sisense on Linux deployment in late 2017. When I was tasked with the responsibility of building a Sisense Linux deployment in late 2017, a few small steps had already been taken.

IT 69
article thumbnail

13 Essential Data Visualization Techniques, Concepts & Methods To Improve Your Business – Fast

datapine

Data visualizations put together in intuitive dashboards can make the analysis process more dynamic and understandable while keeping the audience engaged. While pie charts have received a bad rep in recent years, we feel that they form a useful visualization tool that serves up important metrics in an easy-to-follow format.