Remove B2B Remove Dashboards Remove Optimization Remove Visualization
article thumbnail

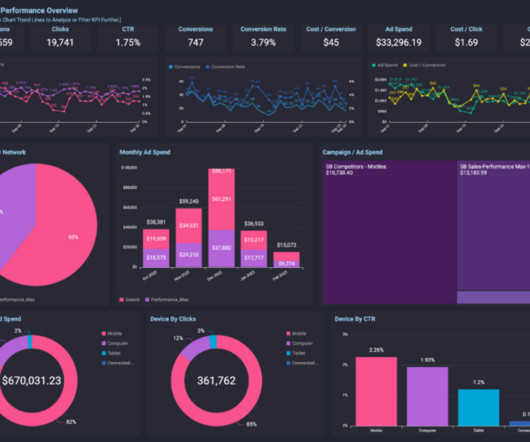
Customer Retention Dashboard & Metrics Examples For Modern Companies

datapine

A customer retention dashboard and metrics depicted in a neat visual will help you in monitoring, analyzing, and managing multiple customer-centric points and how they echo in your business. Your Chance: Want to build a dashboard for customer retention? Try our professional dashboard software for 14 days, completely free!

article thumbnail

Closing Data's Last-Mile Gap: Visualizing For Impact!

Occam's Razor

On a dashboard in Google Data Studio. I see reports, dashboards, presentations with wide gaps. Experiment with visualization options, even in Excel! The bar chart is a sub-optimal way to let the audience see this. Consider experimenting with different visuals in Excel ( or D3js ). On a slide. Why have two fat bars?

Insiders

Sign Up for our Newsletter

This site is protected by reCAPTCHA and the Google Privacy Policy and Terms of Service apply.

Trending Sources

article thumbnail

Salesforce certification guide: Roles, paths, exams, cost, training, requirements

CIO Business Intelligence

To earn this cert, candidates should know how to maintain and modify Sales Cloud and Service Cloud applications; manage users, data, and security; and construct dashboards, reports, and workflows. Prerequisites include earning Salesforce Application Architect certification (see above).

article thumbnail

A Complete Guide On How To Set Smart KPI Targets And Goals

datapine

That said, there are various methods and tools businesses use to manage their data and optimize their performance. With the help of KPI reports , all of these targets can be visualized together to get a complete picture across departments. One of the most powerful ones being key performance indicators (KPIs). Average Transaction Size.

KPI 152
article thumbnail

An Overview of Sales Analytics in Event Industry

BizAcuity

With technology providing a giant window to event activities, organizations within the event industry are optimizing value post event with quantitative ROI reports for sponsors that include real time insights to sales analytics metrics such as Capture Rate, Pipeline Booking pace, customer tracking and other marketing metrics.

Sales 67
article thumbnail

KPI Management And Best Practices: How To Find The Perfect KPI Solutions?

datapine

Catchy headlines, backlinks to relevant influencer content, the seamless placement of a numbered or bulleted and visuals are some of the key drivers of successful digital content. Company A then creates ads, launches a blog, boosts its social media presence, and optimizes its website for enhanced search engine rankings.

KPI 221
article thumbnail

28 Sales Reports Examples You Can Use For Daily, Weekly or Monthly Reports

datapine

Visualize and communicate your findings : the most important part, once you have analyzed and dug out insights from your data, is to convey this information to your audience. Using a professional business intelligence dashboard that works with real-time data will always let you up to date when sharing your insights.

Sales 264