Remove Big Data Remove Dashboards Remove ROI Remove Visualization
article thumbnail

Remove Your Rose Tinted Glasses: Data Visualizations Designed to Mislead

datapine

1) Misleading Data Visualization Examples. 2) How to Avoid Misleading Visuals. 3) The Impact Of Bad Data Visualizations. But while that may be the case, people are duped by data visualizations every day. Bad data visualizations come in many forms, with some more obvious than others.

article thumbnail

Get Started With Business Performance Dashboards – Examples & Templates

datapine

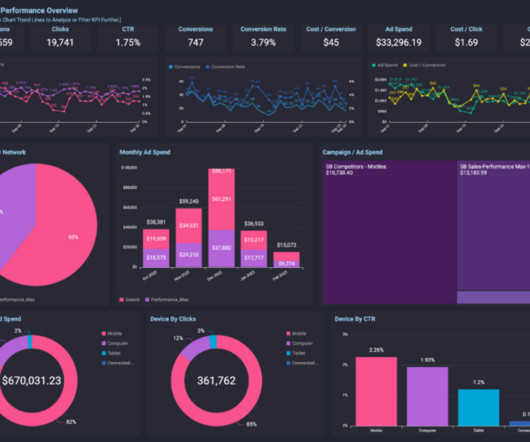
That said, if you’re looking to evolve your empire, increase brand awareness, and boost your bottom line, embracing business performance dashboards and big data should be at the top of your priority list. The Link Between Data And Business Performance. What Is A Performance Dashboard In Business? Still unsure?

Insiders

Sign Up for our Newsletter

This site is protected by reCAPTCHA and the Google Privacy Policy and Terms of Service apply.

article thumbnail

Utilize The Effectiveness Of Professional Executive Dashboards & Reports

datapine

Without big data analytics, companies are blind and deaf, wandering out onto the Web like deer on a freeway. Exclusive Bonus Content: Executive Dashboards & Reports: A Summary. Companies that use data analytics are five times more likely to make faster decisions, based on a survey conducted by Bain & Company.

article thumbnail

What Data Metrics Should Be Incorporated Into a Marketing Dashboard?

Smart Data Collective

Big data has been incredibly important in the marketing profession. Marketers need to rely heavily on big data technology to reach customers more effectively. Big data technology isn’t just important for making better insights. It acts the same as a car’s dashboard.

article thumbnail

A Guide To The Methods, Benefits & Problems of The Interpretation of Data

datapine

2) How To Interpret Data? 3) Why Data Interpretation Is Important? 4) Data Analysis & Interpretation Problems. 5) Data Interpretation Techniques & Methods. 6) The Use of Dashboards For Data Interpretation. Business dashboards are the digital age tools for big data.

article thumbnail

The Ultimate Guide to Modern Data Quality Management (DQM) For An Effective Data Quality Control Driven by The Right Metrics

datapine

More generally, low-quality data can impact productivity, bottom line, and overall ROI. We’ll get into some of the consequences of poor-quality data in a moment. However, let’s make sure not to get caught in the “quality trap,” because the ultimate goal of DQM is not to create subjective notions of what “high-quality” data is.

article thumbnail

Top 15 Warehouse KPIs & Metrics For Efficient Management 

datapine

3) Top 15 Warehouse KPIs Examples 4) Warehouse KPI Dashboard Template The use of big data and analytics technologies has become increasingly popular across industries. In time, this will help you increase customer satisfaction and skyrocket warehouse ROI. Table of Contents 1) What Is A Warehouse KPI?

Metrics 217