Remove Business Analytics Remove Dashboards Remove Interactive Remove IT
article thumbnail

How to Create Stunning and Interactive Dashboards in Excel?

Analytics Vidhya

This article was published as a part of the Data Science Blogathon Introduction I have been using Pandas with Python and Plotly to create some of the most stunning dashboards for my projects. The post How to Create Stunning and Interactive Dashboards in Excel? appeared first on Analytics Vidhya. I […].

article thumbnail

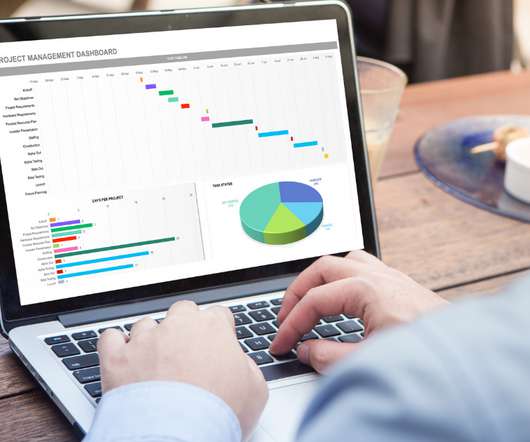
Streamlit vs Gradio – A Guide to Building Dashboards in Python

Analytics Vidhya

As the demand for ML models increases, so makes the demand for user-friendly interfaces to interact with these models. Introduction Machine Learning is a fast-growing field, and its applications have become ubiquitous in our day-to-day lives.

Insiders

Sign Up for our Newsletter

This site is protected by reCAPTCHA and the Google Privacy Policy and Terms of Service apply.

article thumbnail

Accessible Business Analytics Set to Be a Boon for Small Businesses

Smart Data Collective

Small business owners are still prone to see business intelligence as a luxury that they can’t afford, as it requires employing data specialists to manage dedicated data repositories, data consolidation and ongoing coded queries – all of which is a non-starter for organizations where each team member is required to wear so many hats.

article thumbnail

Business Dashboard: Door To Acute Business Insights

FineReport

Business dashboard: definition & benefits. What is a business dashboard? Business dashboards dig information from data and present an easily digestible view of business performance to help strategic and decision-making. Cartoon sketch of business dashboard. Stick to visibility.

article thumbnail

Master Data Visualization Techniques: A Comprehensive Guide

FineReport

Education benefits from data visualization by enhancing learning experiences through interactive visual aids. In business analytics , heat maps are utilized to visualize website traffic patterns or customer behavior, offering valuable insights for strategic decision-making processes.

article thumbnail

Join me at Live! 360 Orlando to learn more about Applied Business Analytics

Jen Stirrup

360 Orlando and I’m presenting a workshop on From Business Intelligence to Business Analytics with the Microsoft Data Platform. Data becomes relevant for decision making when we start to use it properly, so this workshop will demonstrate the use of analytics for real-life use cases.

article thumbnail

Take Advantage Of The Top 16 Sales Graphs And Charts To Boost Your Business

datapine

Because after all – a business dashboard is worth a thousand Excel sheets. These charts and graphs each illustrate crucial aspects of your sales BI department that you would be well served to know in-depth and keep track of. And rather than using Excel or Google Sheets to do so, you can focus on these charts instead.

Sales 235