article thumbnail

Price Optimization in E-Commerce

Analytics Vidhya

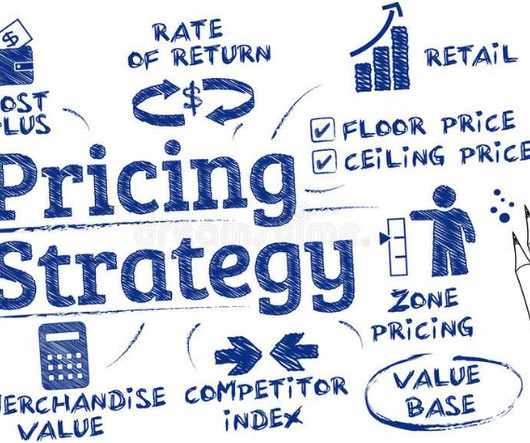
Introduction Price optimization is a critical component of e-commerce that involves setting the right prices for products to achieve various business objectives, such as maximizing profits, increasing market share, and enhancing customer satisfaction.

article thumbnail

What is business analytics? Using data to improve business outcomes

CIO Business Intelligence

What is business analytics? Business analytics is the practical application of statistical analysis and technologies on business data to identify and anticipate trends and predict business outcomes. The discipline is a key facet of the business analyst role. Business analytics techniques.

Insiders

Sign Up for our Newsletter

This site is protected by reCAPTCHA and the Google Privacy Policy and Terms of Service apply.

Trending Sources

article thumbnail

How can CIOs Build Business Value with Business Analytics?

Smart Data Collective

However, the rapid technology change, the increasing demand for user-centric processes and the adoption of blockchain & IoT have all positioned business analytics (BA) as an integral component in an enterprise CoE. They are using analytics to help drive business growth. Extract Value From Customer.

article thumbnail

Accessible Business Analytics Set to Be a Boon for Small Businesses

Smart Data Collective

Small business owners are still prone to see business intelligence as a luxury that they can’t afford, as it requires employing data specialists to manage dedicated data repositories, data consolidation and ongoing coded queries – all of which is a non-starter for organizations where each team member is required to wear so many hats.

article thumbnail

Take Advantage Of Operational Metrics & KPI Examples – A Comprehensive Guide

datapine

Identifying what is working and what is not is one of the invaluable management practices that can decrease costs, determine the progress a business is making, and compare it to organizational goals. But first, let’s begin with a general understanding of key metrics and their usage in business. Marketing: CPC (Cost-per-Click).

KPI 269
article thumbnail

Master Data Visualization Techniques: A Comprehensive Guide

FineReport

Applications in Various Fields In Business , data visualization is used for sales analysis , market forecasting, and performance KPI tracking. For instance, in financial analysis, line plots are utilized to track stock prices over specific periods, enabling analysts to identify market trends efficiently.

article thumbnail

Decoding Data Analyst Job Description: Skills, Tools, and Career Paths

FineReport

Data analysts leverage four key types of analytics in their work: Prescriptive analytics: Advising on optimal actions in specific scenarios. Diagnostic analytics: Uncovering the reasons behind specific occurrences through pattern analysis. Descriptive analytics: Assessing historical trends, such as sales and revenue.