Remove Business Intelligence Remove Dashboards Remove Metadata Remove Visualization
article thumbnail

Business Intelligence for Fairs, Congresses and Exhibitions

Smart Data Collective

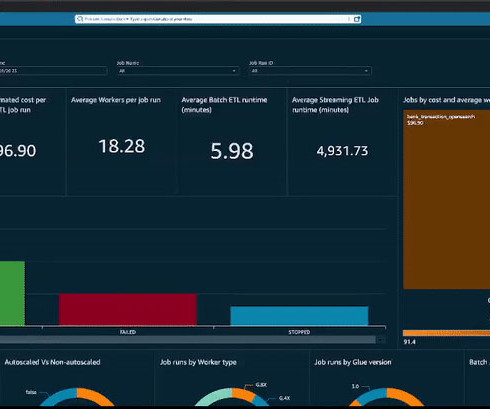
While different companies, regardless of their size, have different operational processes, they share a common need for actionable insight to drive success in their business. Advancement in big data technology has made the world of business even more competitive. This eliminates guesswork when coming up with business strategies.

article thumbnail

How can CIOs safely unleash generative AI on their company’s data?

CIO Business Intelligence

How can business leaders balance these two conflicting considerations? Enter GenBI, the new generation of business intelligence GenBI aims to resolve this dilemma by marrying GenAI and business intelligence (BI). These solutions “understand” your needs and automatically choose the best formulation for your data.

Insiders

Sign Up for our Newsletter

This site is protected by reCAPTCHA and the Google Privacy Policy and Terms of Service apply.

article thumbnail

Enhance monitoring and debugging for AWS Glue jobs using new job observability metrics, Part 3: Visualization and trend analysis using Amazon QuickSight

AWS Big Data

Grafana provides powerful customizable dashboards to view pipeline health. However, to analyze trends over time, aggregate from different dimensions, and share insights across the organization, a purpose-built business intelligence (BI) tool like Amazon QuickSight may be more effective for your business.

Metrics 104
article thumbnail

Visualize Amazon DynamoDB insights in Amazon QuickSight using the Amazon Athena DynamoDB connector and AWS Glue

AWS Big Data

These include internet-scale web and mobile applications, low-latency metadata stores, high-traffic retail websites, Internet of Things (IoT) and time series data, online gaming, and more. Data stored in DynamoDB is the basis for valuable business intelligence (BI) insights. You don’t need to write any code. Choose Next.

article thumbnail

How HR&A uses Amazon Redshift spatial analytics on Amazon Redshift Serverless to measure digital equity in states across the US

AWS Big Data

HR&A has used Amazon Redshift Serverless and CARTO to process survey findings more efficiently and create custom interactive dashboards to facilitate understanding of the results. Figure 1: Workflow illustrating data ingesting, transformation, and visualization using Redshift and CARTO.

article thumbnail

How Huron built an Amazon QuickSight Asset Catalogue with AWS CDK Based Deployment Pipeline

AWS Big Data

Having an accurate and up-to-date inventory of all technical assets helps an organization ensure it can keep track of all its resources with metadata information such as their assigned oners, last updated date, used by whom, how frequently and more. This is a guest blog post co-written with Corey Johnson from Huron.

article thumbnail

Why Data Lineage is King in Business Intelligence

Octopai

Business Intelligence & Analytics: It’s a hard knock life for these guys. This is why a data lineage tool, namely an automated data lineage tool, is king for Business Intelligence teams. . Business Intelligence + data lineage helps companies win . The job description sounds great, right? Other duties?”