Remove Cost-Benefit Remove Dashboards Remove Manufacturing Remove Measurement
article thumbnail

An Introduction To Data Dashboards: Meaning, Definition & Industry Examples

datapine

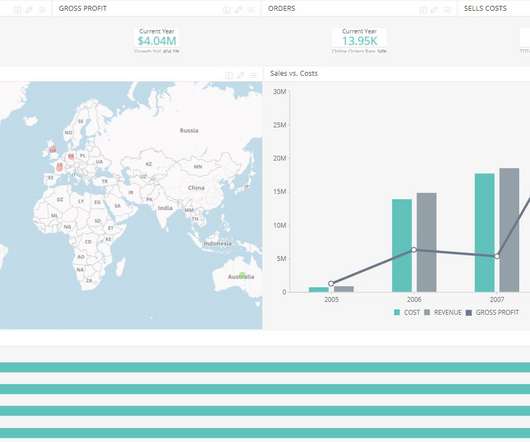
Enter data dashboards – one of history’s best innovations in business intelligence. To help you understand this notion in full, we’re going to explore a data dashboard definition, explain the power of dashboard data, and explore a selection of data dashboard examples. What Is A Data Dashboard? click to enlarge**.

article thumbnail

What is IoT Dashboard?

FineReport

Among the tools that have emerged from this digital transformation, IoT dashboards stand out as invaluable assets. In this article, we will explore the concept of IoT dashboards, delve into their benefits, examine real-life examples, and highlight the essential features that make them indispensable in the IoT landscape.

IoT 52
Insiders

Sign Up for our Newsletter

This site is protected by reCAPTCHA and the Google Privacy Policy and Terms of Service apply.

Trending Sources

article thumbnail

A Beginner’s Guide To Inventory Metrics And Best Practices

datapine

In the matter, data analysis and dashboard designer software is a precious ally. We will finish by presenting a business dashboard that will show how those metrics work together when depicting an inventory data-story. You can calculate it by dividing the costs of goods sold by the average inventory. What Are Inventory Metrics?

Metrics 286
article thumbnail

Discover The Power Of Modern Performance Reports – See Examples & Best Practices 

datapine

To help you get started with the topic, we put together this insightful guide on modern performance reporting using professional online dashboards. Keep reading to find a definition, benefits, examples, and some key best practices to generate them successfully! Let’s dive deeper into the benefits below.

Reporting 207
article thumbnail

A Guide To The Methods, Benefits & Problems of The Interpretation of Data

datapine

6) The Use of Dashboards For Data Interpretation. Business dashboards are the digital age tools for big data. Through the art of streamlined visual communication, data dashboards permit businesses to engage in real-time and informed decision-making and are key instruments in data interpretation. 2) How To Interpret Data?

article thumbnail

A Complete Guide On How To Set Smart KPI Targets And Goals

datapine

3) Benefits Of Setting KPIs Targets & Goals. In order to really ensure you are growing and making the most out of your data-driven efforts, it is necessary to implement measurable goals that will allow you to efficiently assess your strategic efforts. Benefits Of Setting KPI Targets & Goals. Table of Contents.

KPI 152
article thumbnail

Two Downs Make Two Ups: The Only Success Metrics That Matter For Your Data & Analytics Team

DataKitchen

How to measure your data analytics team? Under Velocity, the Mean Time to Deliver Data metric measures the time it takes to deliver data. The Data Change Request Ratio metric measures the rate of business demand for data. The Mean Time to Recovery metric measures how quickly defects can be resolved. Introduction.

Metrics 130