article thumbnail

Key Success Metrics, Benefits, and Results for Data Observability Using DataKitchen Software

DataKitchen

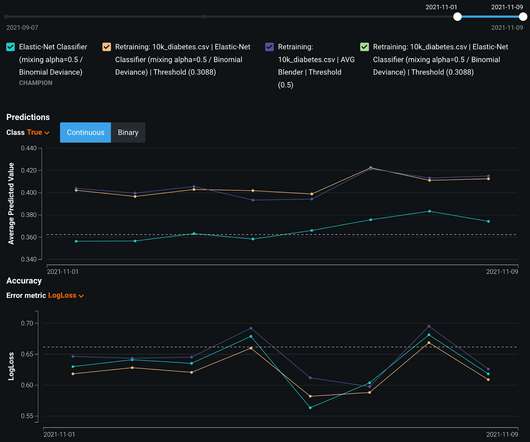
Key Success Metrics, Benefits, and Results for Data Observability Using DataKitchen Software Lowering Serious Production Errors Key Benefit Errors in production can come from many sources – poor data, problems in the production process, being late, or infrastructure problems. Data errors can cause compliance risks.

Metrics 117
article thumbnail

The Ultimate Guide to Modern Data Quality Management (DQM) For An Effective Data Quality Control Driven by The Right Metrics

datapine

6) Data Quality Metrics Examples. Reporting being part of an effective DQM, we will also go through some data quality metrics examples you can use to assess your efforts in the matter. It involves: Reviewing data in detail Comparing and contrasting the data to its own metadata Running statistical models Data quality reports.

Insiders

Sign Up for our Newsletter

This site is protected by reCAPTCHA and the Google Privacy Policy and Terms of Service apply.

Trending Sources

article thumbnail

Enhance monitoring and debugging for AWS Glue jobs using new job observability metrics

AWS Big Data

Today we are pleased to announce a new class of Amazon CloudWatch metrics reported with your pipelines built on top of AWS Glue for Apache Spark jobs. The new metrics provide aggregate and fine-grained insights into the health and operations of your job runs and the data being processed. Under Your jobs , choose your job.

Metrics 96
article thumbnail

6 Key Data Analytics Metrics Website to Track for 2021

Smart Data Collective

Although data analytics tools have offered a number of opportunities and benefits for business owners relying on their websites to reach new audiences, many of them don’t know how to use them effectively. Learning from visitor behaviors and using statistics requires a balance between understanding data and understanding marketing.

Metrics 128
article thumbnail

Remove Your Rose Tinted Glasses: Data Visualizations Designed to Mislead

datapine

From political issues to sports statistics and the recent report you received on the ROI of your company blog, the internet as well as informational reports are flooded with examples of misleading data visualization. But, by knowing what to look for, you can avoid connecting with metrics that will lead your organization down the wrong path.

article thumbnail

Take Complete Charge Of Customer Satisfaction Metrics – Customer Effort Score, NPS & Customer Satisfaction Score

datapine

Read here how these metrics can drive your customers’ satisfaction up! Customer satisfaction metrics evaluate how the products or services supplied by a company meet or surpass a customer’s expectations. Include also expected costs and prepare yourself for unsatisfactory answers of some of your customers.

Metrics 134
article thumbnail

Synthetic data generation: Building trust by ensuring privacy and quality

IBM Big Data Hub

Although adding noise slightly reduces output accuracy (this is the “cost” of differential privacy), it does not compromise utility or data quality compared to traditional data masking techniques. In other words, a differentially private synthetic dataset still reflects the statistical properties of your real dataset.

Metrics 81