article thumbnail

Bubble Wrap: How Eurovision Monitors Covid Risk at Events

CIO Business Intelligence

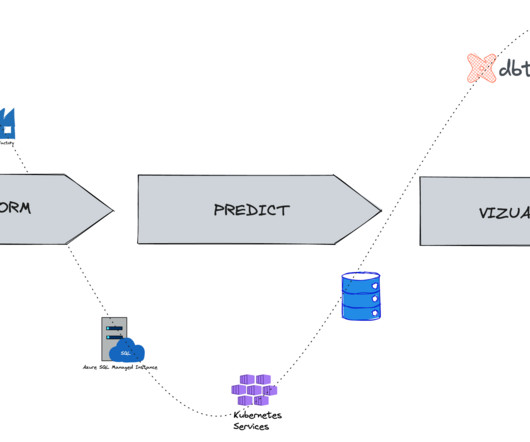
The Eurovision Song Contest, by the way, is the world’s largest live music event, organized each year in May by the local organizer and the European Broadcasting Union. A New Normal: Bubble-Up for Safety at Live Events with Flockey. Flockey provides his team with a dashboard for real-time visualization of crowd movement and risks.

Risk 98
article thumbnail

Utilize The Undeniable Power Of Professional COO Dashboards & Reports

datapine

We won’t delve into details about the career prospects of this C-level position but we will present COO dashboards and reports that are critical for helping chief operating officers across the world to effectively manage their time, company, operational processes, and results. How to create a COO dashboard? What is a COO report?

Insiders

Sign Up for our Newsletter

This site is protected by reCAPTCHA and the Google Privacy Policy and Terms of Service apply.

article thumbnail

3 reasons why business and data analysts need to work with real-time events

IBM Big Data Hub

To meet these objectives, business and data professionals need to go beyond cookie-cutter business intelligence, data visualization dashboards and data analytics tools. Advantages of event-driven solutions This is where event-driven solutions excel.

article thumbnail

Data Analytics and Social Media: Twin Pillars in the Evolution of Business

Smart Data Collective

Two of the biggest advances in technology that are influencing the direction of business are social media and data analytics. Smart businesses will need to know how to leverage data analytics to make the most of their social media strategies. Data Analytics and Social Media Are Collectively Shaping the Future of Business.

article thumbnail

Data science vs data analytics: Unpacking the differences

IBM Big Data Hub

Though you may encounter the terms “data science” and “data analytics” being used interchangeably in conversations or online, they refer to two distinctly different concepts. Meanwhile, data analytics is the act of examining datasets to extract value and find answers to specific questions.

article thumbnail

KPI Dashboard: Keys To Achieve Better Performance

FineReport

KPI dashboard releases you from your worries and troubles. What is a KPI dashboard? Definition of KPI dashboard. KPI dashboard uses interactive charts and data visualization to gather all your KPIs on one dashboard for easy viewing, comparison and analysis. Reality Use of KPI Dashboard.

KPI 52
article thumbnail

An Overview of Sales Analytics in Event Industry

BizAcuity

With more and more information became readily available online in the mid 2000s, companies started taking advantage of it by leveraging big data analytics. Some businesses in 2003 started using predictive analytics generating an average Return on Investment or ROI of 145% as per the study that was undertaken by IDC.

Sales 67