Remove Dashboards Remove Data Collection Remove Information Remove Metrics
article thumbnail

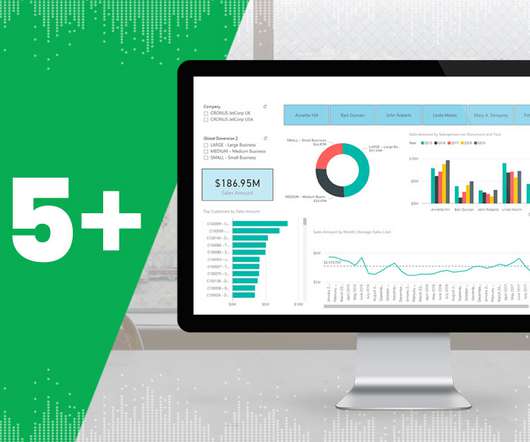
Top Productivity Metrics Examples & KPIs To Measure Performance And Outcomes

datapine

1) What Are Productivity Metrics? 3) Productivity Metrics Examples. 4) The Value Of Workforce Productivity Metrics. Today, employee output is no longer represented by vague descriptions, but by isolated figures that offer insight for improvement in specific areas, which can be found on an HR dashboard. Table of Contents.

article thumbnail

Utilize The Undeniable Power Of Professional COO Dashboards & Reports

datapine

We won’t delve into details about the career prospects of this C-level position but we will present COO dashboards and reports that are critical for helping chief operating officers across the world to effectively manage their time, company, operational processes, and results. How to create a COO dashboard? What is a COO report?

Insiders

Sign Up for our Newsletter

This site is protected by reCAPTCHA and the Google Privacy Policy and Terms of Service apply.

article thumbnail

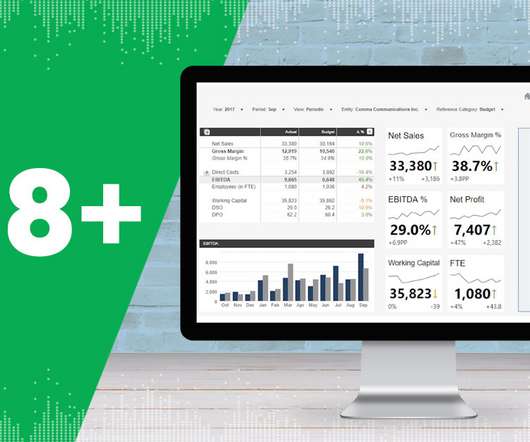
Take Advantage Of Professional CTO Dashboards & Reports

datapine

To successfully gain control and improve a company’s technological needs, CTO dashboards and reports are needed as invaluable tools that consolidate multiple data points and support chief officers in strategic developments as well as online data analysis efforts, empowering their status of champions for new solutions.

article thumbnail

Move Beyond Excel, PowerPoint And Static Business Reporting with Powerful Interactive Dashboards

datapine

Soon businesses of all sizes will have so much amount of information that dashboard software will be the most invaluable resource a company can have. Visualizing the data and interacting on a single screen is no longer a luxury but a business necessity. That’s why we welcome you to the world of interactive dashboards.

article thumbnail

Two Downs Make Two Ups: The Only Success Metrics That Matter For Your Data & Analytics Team

DataKitchen

So it’s Monday, and you lead a data analytics team of perhaps 30 people. But wait, she asks you for your team metrics. Like most leaders of data analytic teams, you have been doing very little to quantify your team’s success. Where is your metrics report? What should be in that report about your data team?

Metrics 130
article thumbnail

Mastering Data Analysis Report and Dashboard

FineReport

Delving into the intricacies of generating insights and facilitating informed decision-making for enterprises, such as achieving precision in advertising placement, is at the heart of this discourse. 2) Second-party data: Often referred to as advertising delivery data, including metrics like ad impressions, page clicks, and ad sources.

article thumbnail

Financial Dashboard: Definition, Examples, and How-tos

FineReport

In today’s dynamic business environment, gaining comprehensive visibility into financial data is crucial for making informed decisions. This is where the significance of a financial dashboard shines through. What is A Financial Dashboard? You can download FineReport for free and have a try!